Adjusting for Referee Bias in NBA Totals
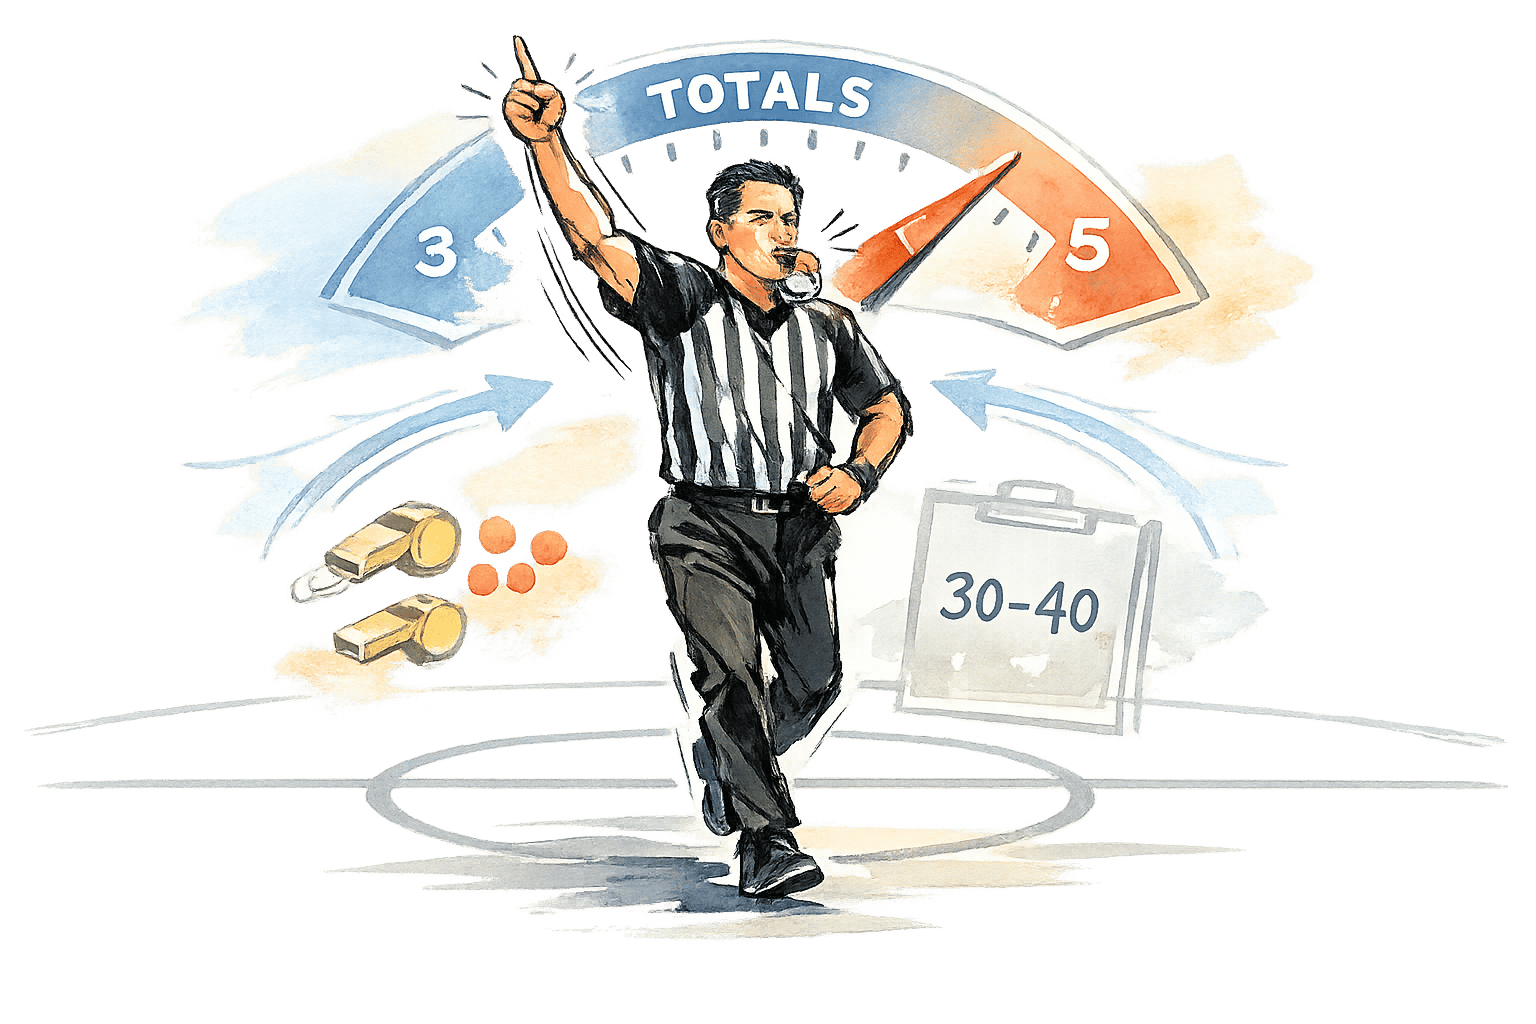
Referee tendencies can directly impact NBA game scoring, making them an important factor in over/under betting. Officials influence pace, fouls, free throw opportunities, and game flow, often shifting totals by 3–5 points. For instance, referees like David Guthrie and Aaron Smith have shown scoring gaps of up to 13 points per game due to their calling styles. Bettors can use historical data and AI tools to analyze these patterns and refine their betting strategies.
Key Points:
- Referees affect scoring through foul calls, free throw frequency, and game tempo.
- Historical trends, such as foul rates and over/under outcomes, are reliable indicators.
- Tools like WagerProof help bettors quickly analyze referee data and market trends.
Identifying Referee Tendencies
How NBA Referee Metrics Impact Game Totals and Betting Outcomes
Once you recognize that referees can influence game outcomes, the next step is to quantify their tendencies through specific metrics. These metrics generally fall into three areas: foul-calling habits, game tempo, and historical over/under outcomes. Together, they reveal how individual officials may impact scoring patterns.
Foul Rates and Free Throw Frequency
One of the most telling metrics is the average number of fouls a referee calls per game. Officials who call more fouls can create two opposing effects: they increase free throw opportunities, which can boost scoring efficiency, but frequent stoppages may slow the game down. For example, during the 2021–22 season, small shifts in foul calls significantly affected game totals.
Not all fouls affect scoring equally. Shooting fouls directly increase free throw attempts and points per possession, often favoring higher-scoring outcomes. On the other hand, non-shooting fouls - like offensive fouls or loose-ball violations - tend to disrupt offensive flow and suppress scoring. Tracking the percentage of fouls that are shooting fouls can help differentiate referees who enhance scoring from those who simply call more fouls overall.
Another key factor is the home-versus-away foul split. Some referees call more fouls against road teams, potentially influenced by the crowd, while others maintain a more balanced distribution. Understanding this tendency can help predict whether an official might favor one team in a specific matchup.
Referee tendencies also extend beyond foul calls, influencing the pace of play and overall game flow.
Pace of Play and Tempo Impact
Referees play a subtle but important role in shaping game tempo. "Pace-friendly" officials allow for quicker inbounds and fewer delays, leading to more possessions and higher scoring opportunities. On the flip side, referees with a "slow cadence" who frequently call non-shooting fouls can disrupt offensive rhythm, reducing the number of possessions and overall scoring chances.
Late-game situations amplify these dynamics. Tighter whistle management often leads to intentional fouling and clock manipulation, which can inflate totals during the closing minutes.
Technical fouls are another factor worth monitoring. Referees who call a high number of technical fouls add extra free throw opportunities and increase scoring variability. This can lead to unpredictable outcomes, especially in tight games.
Historical Over/Under Outcomes
Historical trends in over/under results provide a direct way to assess a referee’s influence on scoring. For instance, in the 2020 season, John Goble officiated games where nearly 70% hit the over, with an average total of about 230 points per game. Patterns like these, measured over a sample of 30–40 games, offer valuable predictive insights.
The 2022–23 playoffs highlighted how wide the range of referee tendencies can be. Lauren Holtkamp averaged 50 fouls per game, while Mark Lindsay averaged just 19. These extremes can provide clear betting signals, especially in matchups where team styles align with the referee’s tendencies - like games featuring teams with high free throw attempt rates.
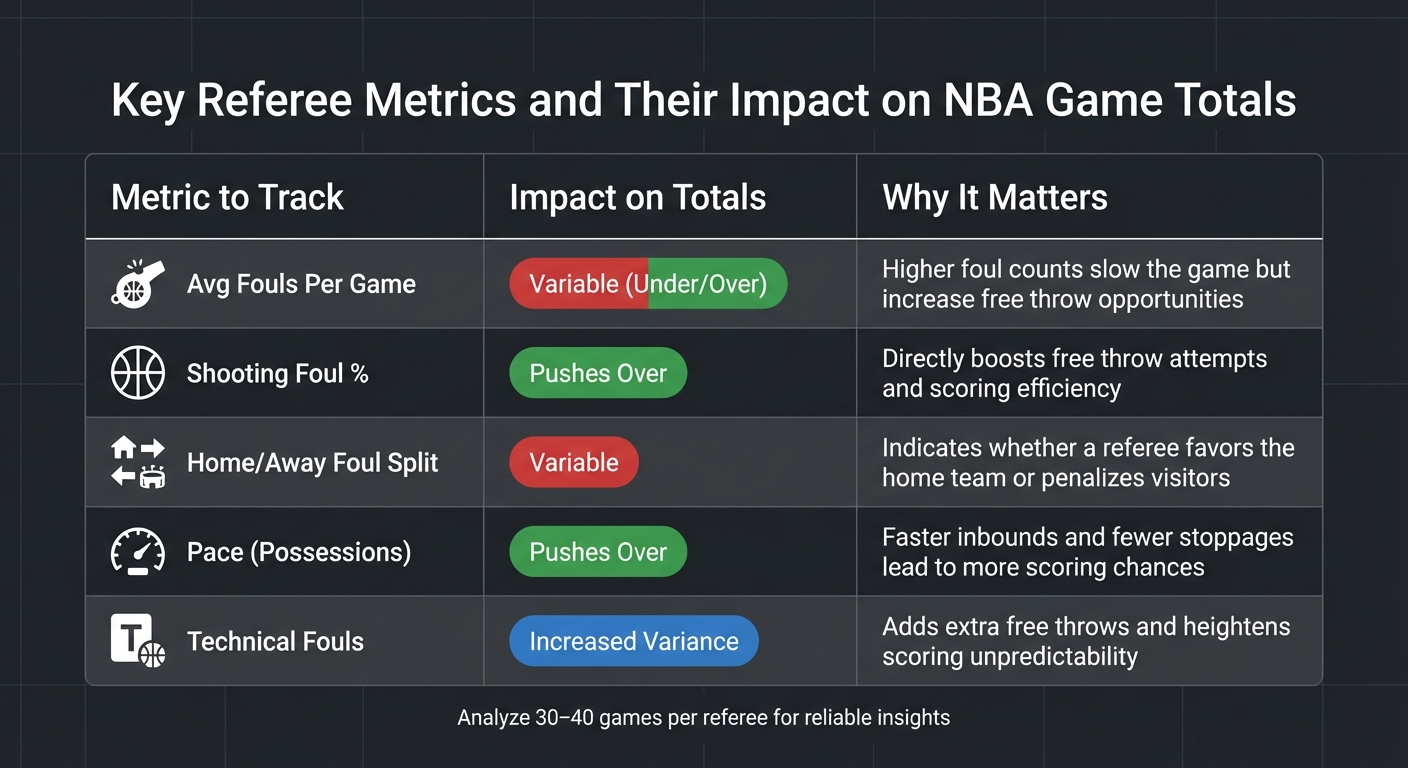
Here’s a breakdown of key metrics and their impact on game totals:
| Metric to Track | Impact on Totals | Why It Matters |
|---|---|---|
| Avg Fouls Per Game | Variable (Under/Over) | Higher foul counts slow the game but increase free throw opportunities |
| Shooting Foul % | Pushes Over | Directly boosts free throw attempts and scoring efficiency |
| Home/Away Foul Split | Variable | Indicates whether a referee favors the home team or penalizes visitors |
| Pace (Possessions) | Pushes Over | Faster inbounds and fewer stoppages lead to more scoring chances |
| Technical Fouls | Increased Variance | Adds extra free throws and heightens scoring unpredictability |
Since NBA officiating crews are announced at 9:00 AM ET on game day, betting totals often shift by half a point or more as sharp bettors act on referee data. To get reliable insights, it’s crucial to analyze at least 30–40 games per referee to avoid overreacting to isolated performances.
Checklist: Adjusting NBA Totals for Referee Bias
Step 1: Review Referee Assignments
Start by checking NBA.com for referee crew assignments at 9:00 AM ET on game day. Tools like RefMetrics and DonaghyEffect can provide detailed historical data on all three officials - not just the crew chief.
It's important to evaluate the entire three-person crew because their combined tendencies shape the game's flow. Use platforms that calculate crew-level metrics to understand how their officiating style has historically influenced foul rates and game totals. Once you've reviewed this, move on to analyzing foul and free throw data.
Step 2: Analyze Foul and Free Throw Data
Compare each referee's average foul calls to the league baseline. Pay close attention to the shooting foul percentage, as referees who call more shooting fouls often lead to increased free throw attempts and higher scoring efficiency.
Look at how fouls are distributed between home and away teams to identify any potential bias that could affect the game total. Ensure you’re working with a sample size of at least 30–40 games per official to avoid skewed results. For a deeper dive, RefMetrics tracks data on 108 NBA officials across 8 seasons and over 10,500 games.
Step 3: Adjust for Game Pace
Start with your baseline total using team metrics like offensive and defensive ratings. Then, factor in how the assigned referee crew impacts game pace. Officials who encourage quick inbounds and minimize stoppages tend to increase possessions and scoring opportunities. On the other hand, referees who call frequent non-shooting fouls - like moving screens or offensive fouls - can disrupt offensive flow and lower scoring chances. Refine your projections by incorporating these tendencies into your analysis.
Step 4: Use AI Tools for Refinement
Tracking referee data manually can be time-consuming, so consider leveraging AI-powered platforms to integrate referee tendencies with team metrics in real time. These tools simplify the process by focusing on large sample sizes and identifying when a referee crew's style aligns with specific team dynamics. Since referee assignments are released at 9:00 AM ET and betting lines often shift shortly after, automated tools can give you a speed advantage. Platforms like WagerProof, for example, use AI to analyze referee assignments and team data together, helping you spot opportunities before the market adjusts.
Step 5: Cross-Check with Prediction Markets
After refining your total, compare it to the current market line. If your model predicts a total that’s 3–5 points higher or lower than the market and aligns with the referee crew’s tendencies, you may have an edge. Keep an eye on how the line moves throughout the day. If sharp bettors adjust the total in the direction of your analysis, it confirms your findings. If not, revisit your variables or consider that the market may have additional insights. Early action is key, as prediction markets often react quickly once referee assignments are announced.
Using WagerProof for Referee Bias Analysis

Referee tendencies can significantly influence game outcomes, and WagerProof takes this concept further by using advanced AI tools to refine totals analysis.
AI Research Agents for Referee Analysis
WagerProof's AI research agents monitor over 75 referees across more than 1,300 games per season, uncovering patterns that can shift betting lines before the market catches on. These agents calculate each referee's average fouls per game and assign a "total tilt" score - a percentile ranking that measures how much a referee leans toward the over or under compared to league norms.
With over 50 adjustable parameters, these agents flag situations where a referee crew's historical 3–5 point impact isn't yet factored into the betting lines. Incorporating this data has reportedly helped users improve their win rates by 15% to 20%.
"Knowing which referee is officiating completely changes my betting strategy. Scott Foster has clear patterns - he tends to call games tighter, especially with certain teams." - Marcus Chen, Pro Bettor
Real-Time Data Integration
WagerProof provides live data streams that combine referee assignments, foul trends, and market signals into one comprehensive analysis. You can even ask questions in plain English, like, "How does Scott Foster affect Lakers totals?" The system will respond with a detailed breakdown, such as his 24.1 average fouls per game against Los Angeles and a 67% over rate.
Automated alerts notify you when referee assignments create a potential betting edge. For instance, if David Guthrie is assigned to a game and the total hasn’t adjusted accordingly, you'll get an instant notification. This real-time edge is crucial because betting lines often shift within hours after referee assignments are announced. All of this integrates seamlessly with WagerProof’s customizable analysis tools.
Transparency and Customization
WagerProof ensures complete transparency by making all AI agent results publicly accessible. Users can even create custom crew profiles using the three-official model to analyze how a crew’s foul tendencies and pace dynamics interact. The platform clearly identifies the variables - like shooting foul percentages or pace disruptions - that drive its recommendations.
Additionally, WagerProof automatically highlights outliers, such as when betting spreads don’t align with referee tendencies or when sharp money begins to move the line in your favor. This unified approach simplifies referee data analysis, helping you spot value opportunities more effectively.
Conclusion
Looking at the data, there are actionable ways to improve NBA totals betting by factoring in referee tendencies. This often-overlooked detail can be a game-changer when integrated into your overall odds model.
Key Takeaways
Referee tendencies present a real opportunity to exploit inefficiencies in the betting market. For example, officiating crews that call 2–3 more fouls per game than the league average can shift totals by 3–5 points. However, the betting market typically undervalues this impact by 0.5–1.5 points, leaving room for savvy bettors to capitalize.
The best approach is to view referee analysis as a secondary adjustment to your main model. Start with a foundation based on team pace and efficiency, then layer in referee data when it aligns with team tendencies. High-foul crews, for instance, tend to increase free throw attempts (adding 1.0–1.5 points per possession), and while stoppages might slow the game, the boost in efficiency often results in higher totals.
Even in a highly efficient market like the NBA, referee analysis can offer a 1%–2% edge on totals when applied consistently over hundreds of games. Tools like WagerProof's AI agents help identify unnoticed referee trends across thousands of games, giving you an edge before the market adjusts.
With this knowledge, bettors can take steps to make more informed decisions.
Next Steps for Bettors
To put this into practice, start by checking referee assignments early - around 9:00 AM ET. Dive into foul and free throw data over a sample of 30–40 games, and adjust for pace based on the tendencies of each officiating crew. Focus on long-term averages rather than single-game anomalies to identify consistent biases.
WagerProof's AI tools make this process easier by combining referee data, foul trends, and market insights into one streamlined platform. Use WagerBot Chat to ask detailed questions in plain English and receive instant, data-driven answers. You can also set up automated alerts to flag betting opportunities tied to referee assignments. With transparent breakdowns of the key variables behind each recommendation, these tools are designed to support smarter, more confident betting decisions.
FAQs
How do I adjust an NBA total for a specific referee crew?
Referee tendencies can significantly affect NBA game totals. For example, referees who whistle a lot of fouls tend to slow the game down, leading to more free throws but fewer scoring opportunities in regular play. On the other hand, lenient referees who allow more physical play may keep the game flowing, potentially increasing the total score.
When analyzing totals, it’s important to consider how the referee crew’s style aligns with the teams involved. Does a foul-heavy crew disrupt a fast-paced team’s rhythm, or does it favor a team that thrives on free throws? Similarly, a more relaxed officiating style might benefit teams with strong offensive momentum. Adjusting the total by a few points - up or down - based on these dynamics can make predictions more precise.
What referee stats matter most for over/under betting?
Referee stats play a crucial role in over/under betting. Key factors to watch include foul frequency, pace impact, and how referees handle stoppages and free throw opportunities. Referees who call a high number of fouls tend to slow the game down and lead to more free throws, both of which can heavily influence the total points scored in a game.
How many games of referee data do I need to trust a trend?
To spot reliable trends, it's crucial to analyze referee data from a minimum of 30 games. This sample size minimizes variability and brings consistent patterns to light, such as foul rates or how referees influence the pace of the game.
Related Blog Posts
Ready to bet smarter?
WagerProof uses real data and advanced analytics to help you make informed betting decisions. Get access to professional-grade predictions for NFL, College Football, and more.
Get Started Free