Algorithm Auditing for Transparent Betting Models
Algorithm auditing ensures betting models are reliable, unbiased, and easy to verify. This involves analyzing data sources, how predictions are made, and performance metrics like ROI, calibration, and Closing Line Value (CLV). Transparency is key - bettors need clear, reproducible insights to trust these systems.
Key takeaways:
- Transparency builds trust: Clear documentation and reproducible results are essential for accountability.
- Metrics matter: Calibration, ROI, and risk-adjusted returns (e.g., Sharpe ratio, drawdown) assess long-term model performance.
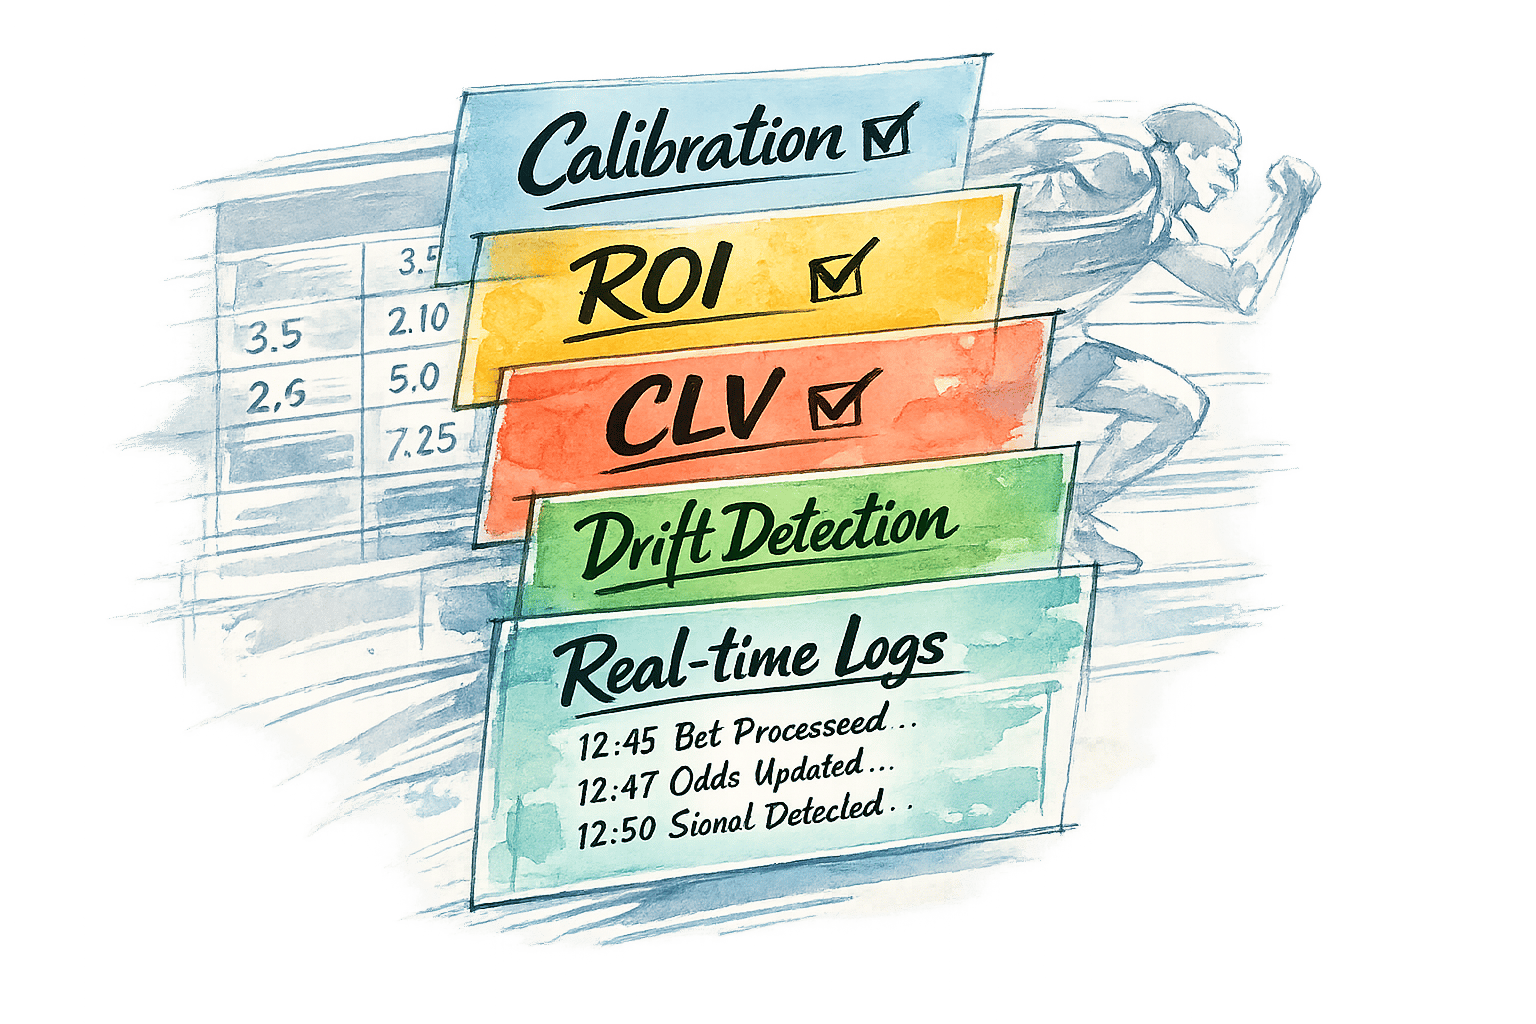
- Real-time monitoring: Tools like WagerProof provide live insights, track model drift, and flag anomalies.
- Audit routines: Daily, weekly, and monthly checks identify errors, biases, and areas for adjustment.
WagerProof stands out by offering detailed logs, real-time updates through WagerBot Chat, and automated outlier detection, helping bettors make informed decisions while reducing risks.
Key Metrics for Auditing Betting Model Performance
Accuracy and Calibration Metrics
Relying solely on accuracy can be misleading. For instance, a model with a 55% hit rate might seem effective, but if it consistently assigns 70% confidence to those picks, it’s poorly calibrated. Calibration ensures that predicted probabilities match actual outcomes - if a model predicts a 60% chance, the event should occur about 60% of the time.
The Brier score helps quantify calibration by measuring the squared differences between predicted probabilities and actual outcomes. Lower scores indicate better calibration. Another useful metric, Expected Calibration Error (ECE), measures the weighted difference between predicted probabilities and observed frequencies, making it a practical tool for tracking calibration in real time. While these metrics focus on accuracy and alignment, evaluating return on investment (ROI) and risk-adjusted measures is equally important for a complete performance picture.
ROI and Risk-Adjusted Returns
Metrics like ROI provide insight into how efficiently a model converts wagers into profit, showing net profit as a percentage of funds wagered. However, ROI alone can be deceptive. For example, a +15% ROI over just 50 bets might reflect short-term luck rather than long-term reliability. This is where Closing Line Value (CLV) comes into play. CLV compares the odds you bet at to the final market odds (after the vig is removed). If your ROI significantly exceeds your CLV, it could signal that your results are driven by variance rather than a sustainable edge.
Risk-adjusted metrics help assess the long-term viability of a model. The Sharpe ratio, for instance, measures return relative to risk, while maximum drawdown highlights the steepest drop in bankroll from a peak. These metrics answer critical questions like: How much capital is needed to endure losing streaks? Is the model’s profit worth the associated volatility? For example, a 12% ROI with a 30% drawdown requires different bankroll management compared to an 8% ROI with only a 10% drawdown. Additionally, sample size matters - a reliable evaluation typically requires analyzing 100 to 1,000 bets. Models with strong calibration often deliver better ROI over time.
Real-Time Performance Tracking
Static metrics are valuable, but real-time tracking ensures your model adapts to changing conditions. Using continuous performance monitoring over intervals like 100, 250, or 1,000 bets can help identify trends. For example, league dynamics can shift due to factors like coaching changes, player performance, or rule adjustments. A model that excels in NBA totals during November might falter by February if it fails to adjust.
CLV tracking offers an early signal of whether your model is still finding value. By comparing your betting odds to the no-vig closing market price, you can gauge whether your model is uncovering genuine opportunities or simply following market trends. Tools like WagerProof’s automated outlier detection can flag mismatches between model predictions and live market odds, helping you identify when your model might be overlooking critical updates like injuries or weather conditions. To ensure ongoing calibration, statistical tests such as the Kolmogorov-Smirnov test can be run weekly. These tests compare current model outputs to historical baselines, allowing you to catch and address calibration drift before it leads to significant losses.
Methods for Auditing Sports Betting Algorithms
Manual Auditing Methods
Manual audits allow for detailed evaluation of sports betting algorithms, ensuring both transparency and accountability. One common approach is backtesting, where you run the model on historical, unseen data to gauge its predictive capabilities. Testing on training data only reveals how well the model memorizes patterns, but backtesting with fresh, out-of-sample data shows its true ability to generalize.
Another method is cross-validation, which divides historical data into segments. The model is trained on one segment and tested on another, cycling through all segments. This approach helps verify whether the model consistently performs across various time frames or if it overfits to certain conditions. For example, a model trained on NBA games from October to December might falter in March as team dynamics and player performance evolve.
Feature importance analysis is also crucial - it identifies which factors, such as recent performance or home-court advantage, influence the model's decisions the most. To ensure a clear audit trail, maintain a version log for every model update. This documentation prevents retroactive changes and allows for reproducibility, complementing automated systems that monitor performance continuously.
Automated Monitoring Systems
Automated systems excel at tracking performance metrics in real time, reducing the burden of repetitive tasks. Dashboards should highlight key indicators like ROI and calibration error over rolling windows, such as the last 100, 250, or 1,000 bets. Set up alerts to flag significant deviations from historical benchmarks, prompting immediate review.
For transparency, log every model update with a timestamp. A robust system should capture and evaluate every signal using reproducible logs. Incorporating UTC timestamps and preserving market context for each prediction strengthens the audit trail, making the process more reliable. Drift detection algorithms are also important, as they monitor shifts in model inputs or outputs - like changes in data feed formats or rule adjustments. Additionally, automated systems should link to reproducibility artifacts, such as environment files or model cards, enabling independent verification of results.
Detecting Anomalies in Model Outputs
Automated anomaly detection builds on continuous monitoring by identifying unusual patterns that require immediate attention. Daily reconciliation of predicted versus actual outcomes can quickly expose errors, such as data feed issues or sudden failures. When there’s a noticeable drop in performance, a detailed investigation is essential. As Researchers.Site notes:
Transparency is risk management: clear disclosures protect reputation, reduce regulatory risk, and improve reader trust.
Publishing findings from these investigations, including observations, suspected causes (e.g., data shifts or roster changes), and interim measures, helps build trust and credibility over time.
Auditing WagerProof AI Agents for Transparency

Using the Transparent Interface
WagerProof's platform ensures accountability by offering public logging and complete parameter visibility for every agent. Each agent's predictions are recorded with timestamps, the odds at the time of the decision, and the actual outcomes, creating a permanent log that can be reviewed at any time. Through the dashboard, you can access a detailed, timestamped history of every agent, including their odds, outcomes, and decision-making parameters.
What makes this interface stand out is its ability to show not just win-loss records but also the exact parameters influencing each decision. These include settings like risk tolerance, weighting for recent versus historical performance, and situational multipliers. This transparency allows you to pinpoint which configurations perform well under specific conditions and which might need tweaking. For example, if an agent with a high-risk tolerance consistently struggles in certain scenarios, you could adjust that parameter and track its impact on future bets. This robust logging also supports dynamic queries and automated alerts to streamline monitoring.
Using WagerBot Chat for Agent Performance Queries
WagerBot Chat offers a natural language interface that connects directly to live professional data sources, making it easy to audit agent performance without manually extracting data. You can ask questions like, "How has my NBA agent done with road underdog bets in the last 30 days?" or "What’s the calibration error for my NFL agent’s over/under picks since January 1st?" WagerBot provides instant access to key metrics, saving time and effort.
The chat tool doesn’t just pull historical data - it also integrates real-time information, such as injury updates, weather conditions, and line movements. This feature is invaluable during audits, especially if you’re trying to understand why an agent's performance dipped. For instance, WagerBot can help determine if a drop was due to changes in data feeds, overlooked player injuries, or shifts in market trends.
Automating Outlier Detection
Beyond manual and chat-driven audits, WagerProof employs automated outlier detection to ensure model reliability. The platform continuously scans for unusual patterns or discrepancies in prediction markets that could indicate model drift or data quality issues. It sends alerts when an agent’s spread predictions deviate significantly from consensus market values. These alerts can either point to potential value bets or signal that the model might be relying on outdated or flawed data.
The system also tracks deviations that exceed pre-set thresholds, helping you investigate whether the agent is uncovering genuine market inefficiencies or if there’s a technical issue at play. Additionally, it flags "fade signals", where public betting percentages favor one side heavily, but money moves in the opposite direction. These insights help ensure your agents maintain disciplined, data-driven strategies while staying alert to market dynamics.
Best Practices and Audit Checklist for Betting Models
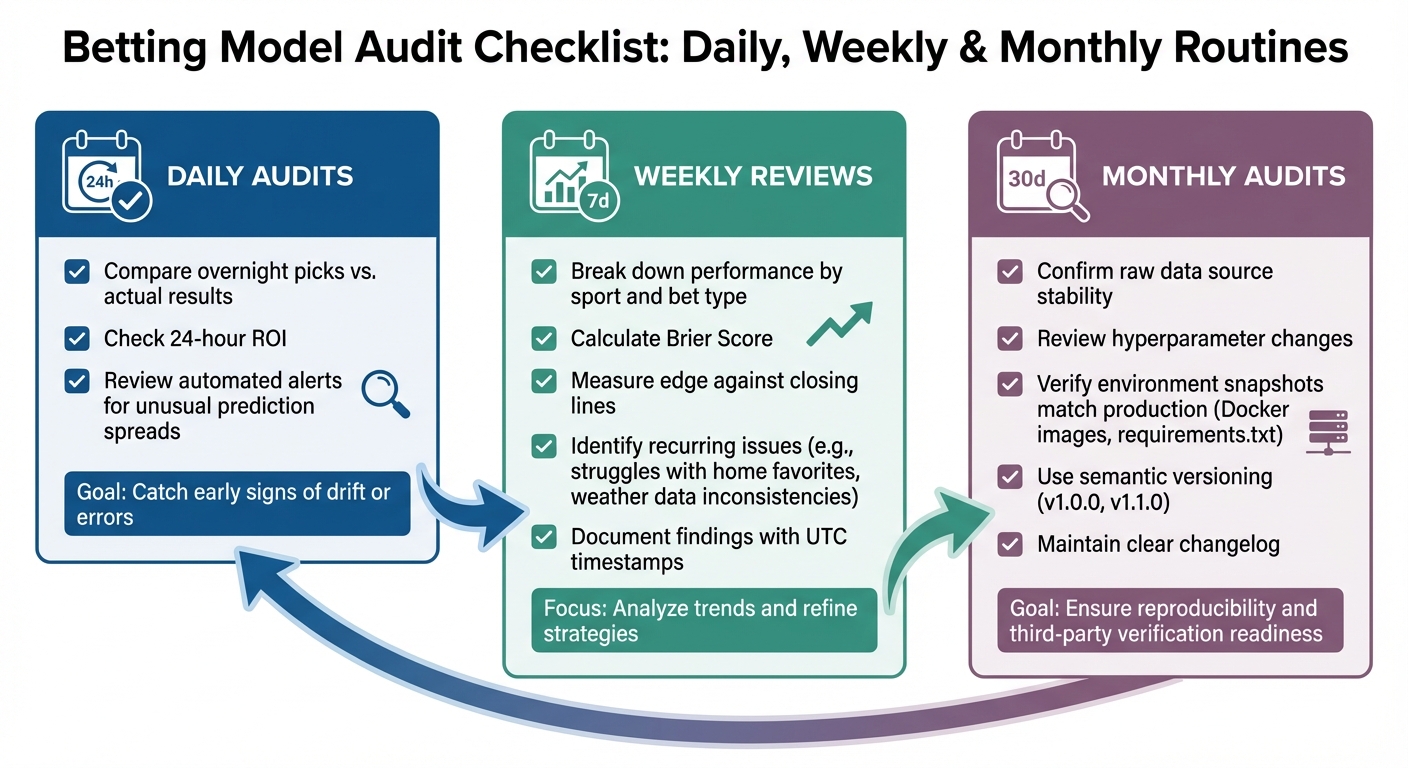
Betting Model Audit Framework: Daily, Weekly, and Monthly Routines
Daily, Weekly, and Monthly Audit Routines
Daily audits focus on keeping tabs on immediate performance indicators. Start by comparing agents' overnight picks with actual results, checking the 24-hour return on investment (ROI), and reviewing automated alerts for unusual prediction spreads. These quick checks help catch early signs of drift or errors.
Weekly reviews take a more detailed look. Break down agent performance by sport and bet type, then calculate metrics like the Brier Score and the edge against closing lines. Look for recurring issues - maybe an agent struggles with home favorites, or perhaps weather data inconsistencies are affecting outdoor sports predictions. Keep detailed records of findings, including UTC timestamps, to ensure your documentation stays clean and organized.
Monthly audits are all about accountability. Confirm that raw data sources are stable, review any changes made to hyperparameters, and double-check that your environment snapshots (like Docker images or requirements.txt files) match the production setup. Use semantic versioning (e.g., v1.0.0, v1.1.0) and maintain a clear changelog. This level of documentation is crucial for reproducibility and for any third-party verification needs.
Bias Detection and Prevention
Routine audits aren’t just about performance - they also help uncover hidden biases that could skew predictions. Biases often emerge in areas with limited data. For instance, if your model predicts outcomes for teams with little historical data - like newly promoted soccer teams or lesser-known college basketball programs - it might produce extreme or unreliable results. Using Segmented Expected Calibration Error (ECE) can help pinpoint these issues by breaking down calibration metrics by team, league, and market type, revealing where predictions stray furthest from reality.
To address these biases, apply strategies like weight smoothing and setting minimum data thresholds. For example, don’t allow an agent to bet on a team until there’s data from at least 20 games, or blend sparse-data predictions with league-wide averages to avoid extreme forecasts.
Long-Term Model Accountability
Transparency and consistency are key to maintaining long-term accountability for your betting models. Start by documenting data provenance - track the source of every data point, note the acquisition time (using UTC timestamps), and detail how missing values were handled. If, for example, injury reports are incomplete on a given day, clearly explain the imputation method used. Also, make sure to disclose any conflicts of interest, such as affiliate partnerships, financial stakes in certain picks, or ties to bookmakers.
Monitor both statistical metrics (like Log Loss and Brier Score) and economic metrics (like ROI and edge versus closing lines), and include uncertainty bounds. For example, a 5% ROI with a 95% confidence interval of ±8% paints a very different picture than one with an interval of ±2%. Keep your records audit-ready for third-party verification. Tools like WagerProof can help by creating permanent, timestamped logs of every agent’s decisions, parameters, and outcomes - ensuring that accountability isn’t just a one-time effort but an ongoing practice. Daily, weekly, and monthly routines all contribute to this long-term framework.
Conclusion
Algorithm auditing plays a crucial role in creating reliable sports betting systems. Without consistent, metrics-driven evaluations, even the most advanced models risk becoming overconfident, developing unnoticed biases, or delivering inconsistent predictions. What often separates professional bettors from casual gamblers is accountability - understanding exactly how a model operates, why it behaves a certain way, and how its performance holds up over time. These principles form the foundation of the metrics and processes discussed earlier.
The metrics highlighted earlier provide a solid framework for assessing both financial outcomes and prediction accuracy. Metrics like a 3%–7% ROI or beating closing lines by 1%–2% help distinguish effective models from random noise. Pairing these benchmarks with regular audit routines - daily, weekly, and monthly - creates a system that identifies issues early and ensures models remain accurate over the long term.
Transparency is the engine that drives effective auditing. By thoroughly documenting data sources, UTC timestamps, hyperparameters, and reproducibility details, you build a system that supports verification and reproducibility. This level of detail is critical, whether you're reviewing your own results or presenting your findings to others.
The WagerProof platform is a great example of how transparency can be integrated into sports betting tools. Its AI research agents maintain public, timestamped records of every decision, parameter, and result. With WagerBot Chat, users can ask plain-English questions about agent performance, accessing insights that combine weather updates, injury reports, odds changes, and model predictions - all without fabricating information. Automated outlier detection further enhances monitoring by identifying mismatches in prediction markets and spotting value betting opportunities, ensuring models are supervised in real time.
The goal of auditing isn't to achieve perfection - it’s about constant progress. Models evolve, data shifts, and biases can creep in. The strategies and tools discussed here provide the framework to stay ahead, uphold accountability, and make informed betting decisions over the long run.
FAQs
What’s the fastest way to tell if my model is actually beating the market?
The fastest way to see if your model is beating the market is by keeping an eye on critical metrics like Closing Line Value (CLV), ROI, and win rate. These metrics are essential for verifying both long-term profitability and your model's competitive advantage.
How many bets are needed to trust ROI and calibration stats?
To trust ROI and calibration statistics, it's important to track these metrics over a large enough sample size, typically at least 100 bets. This ensures that your model's performance is both consistent and statistically reliable. Regularly reviewing these results is crucial for confirming both profitability and calibration accuracy.
What should I do when CLV stays strong but ROI turns negative?
If your CLV (Closing Line Value) is solid but your ROI (Return on Investment) dips into the negative, it’s a sign that while your bets are outperforming the closing odds, they’re not yielding profits. This could be due to several factors, such as variance, ineffective stake management, or shifts in market conditions.
To address this, take a closer look at your staking strategy, evaluate how you’re managing your bankroll, and ensure your model is properly calibrated. It’s also important to keep an eye on key metrics like your win rate and any changes in the market. These steps can help ensure that your edge translates into steady profits over time.
Related Blog Posts
Ready to bet smarter?
WagerProof uses real data and advanced analytics to help you make informed betting decisions. Get access to professional-grade predictions for NFL, College Football, and more.
Get Started Free