How to Analyze Historical ROI in Sports Betting
Want to know if your sports bets are profitable? Start by calculating your Return on Investment (ROI).
Tracking wins and losses isn't enough. ROI shows how efficiently your wagers turn into profit, cutting through win rates and luck. Here's a quick breakdown:
- ROI Formula: (Net Profit / Total Wagered) × 100
- Example: $1,000 wagered with $80 profit = 8% ROI
- Why It Matters: High win rates don’t guarantee profits - ROI reveals the true performance of your strategy.
To improve, organize your betting data, calculate ROI by categories (e.g., sport, bet type), and use tools like WagerProof for deeper insights. Professional bettors aim for 5-10% ROI annually. Ready to track smarter and bet better? Let’s dive in.
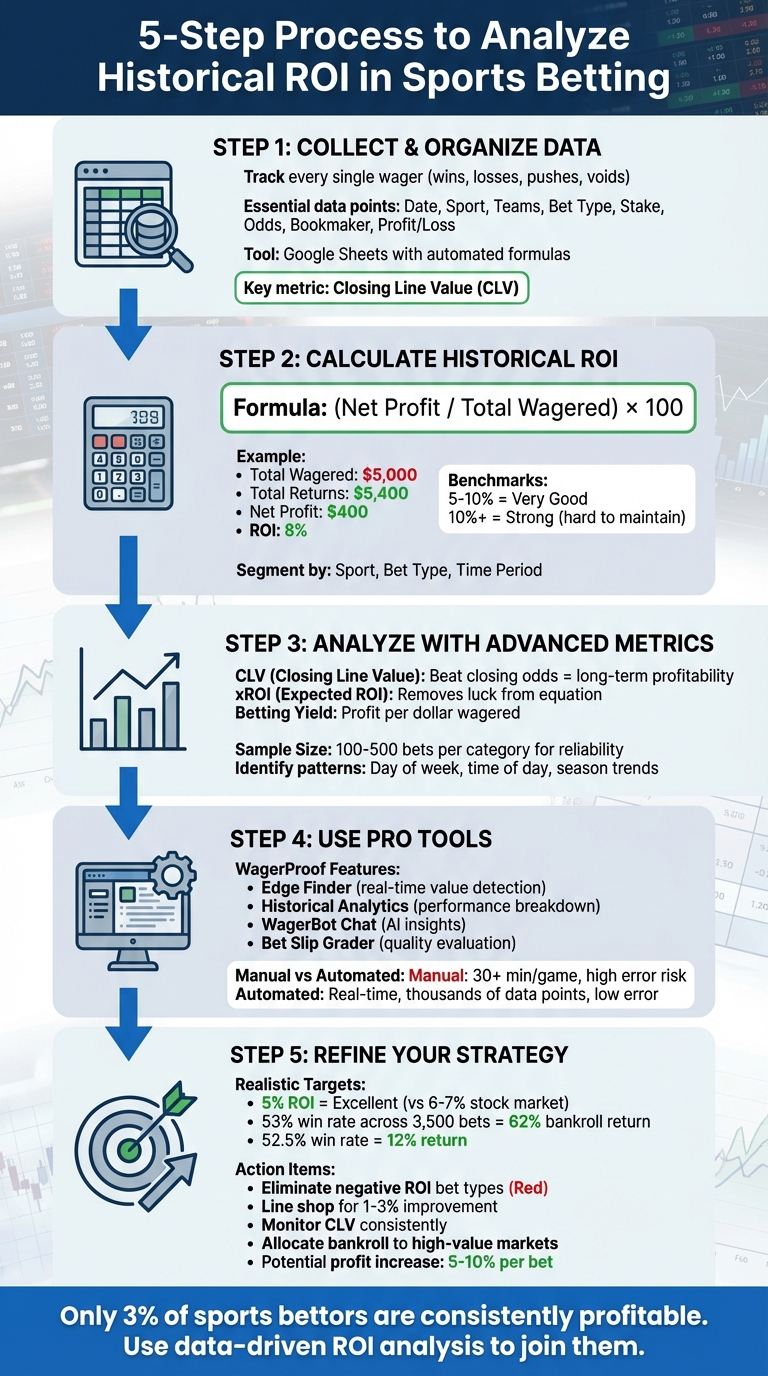
5-Step Process to Analyze Historical ROI in Sports Betting
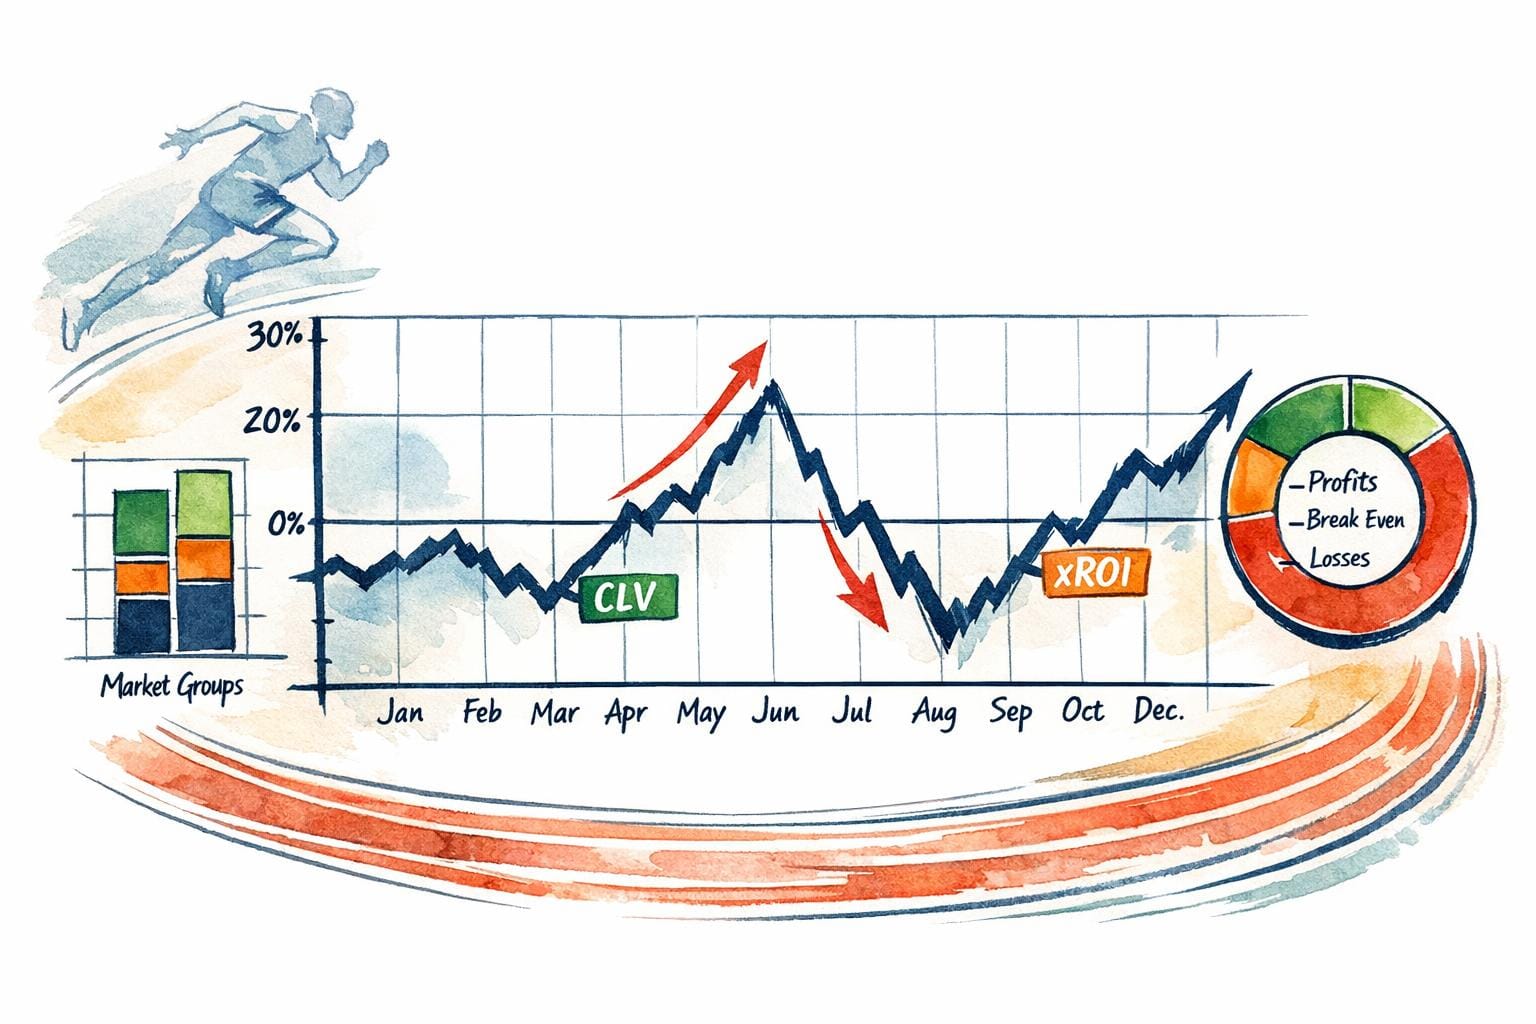
This Sports Betting Strategy Consistently Makes 30%+ ROI Every Year
Step 1: Collect and Organize Your Betting Data
To calculate ROI effectively, you need a thorough record of your betting history. Every single wager counts - even the ones that seem insignificant or spur-of-the-moment. As Jimmy Boyd from BoydsBets points out, "Memory can be selective – big wins stick in your mind, while frequent small losses slip through the cracks". Leaving out any bets can skew your analysis and give you an incomplete picture of your performance.
Key Data Points to Track
Your tracking system should capture both basic details and additional insights that can help you identify patterns or advantages. Start with the essentials:
- Date: Use the MM/DD/YYYY format.
- Sport or League: Specify the type of event.
- Event and Teams: Include the matchup or competition.
- Your Selection: Note the side or total you bet on.
- Bet Type: Record whether it's a moneyline, spread, total, prop, or parlay bet.
- Stake Amount: Log your wager in USD, down to two decimal places.
- Odds: Use decimal format (e.g., 1.91).
- Bookmaker: Identify where the bet was placed.
- Profit or Loss: Track the financial outcome of each bet.
Beyond these basics, include the outcome (Win, Loss, Push, or Void) and the closing line - the final odds or spread right before the game begins. Comparing your odds to the closing line helps you calculate Closing Line Value (CLV), which is a key metric for assessing long-term profitability. Consider adding a notes column to log your reasoning, confidence level (on a 1–10 scale), or external factors like weather or injuries.
Once you’ve gathered this data, organize it for clarity and accuracy.
Tips for Organizing Data
Google Sheets is a practical and accessible tool for tracking your bets across devices or using real-time sports data platforms. Use dedicated columns and dropdown menus for fields like "Status" or "Sport" to avoid errors. Automate profit and loss calculations with simple formulas, such as:
=IF(Status="Won", (Stake*Odds)-Stake, IF(Status="Lost", -Stake, 0))
This reduces manual mistakes and ensures consistency.
Log each bet immediately after placing it, and use conditional formatting to visually differentiate outcomes - highlight wins in green and losses in red. Regularly review your spreadsheet for duplicate entries, missing information, or formatting inconsistencies to keep your data clean and reliable.
And here's a reality check: only about 3% of sports bettors consistently turn a profit in the long run. Keeping detailed, accurate records is a critical step toward being part of that small group.
Once your data is well-organized, you’re ready to dive into calculating your historical ROI.
Step 2: Calculate Your Historical ROI
Once you've organized your betting data from Step 1, it's time to calculate your historical ROI. The formula is straightforward: (Net Profit / Total Amount Wagered) × 100. Here, your net profit is the total returns - which includes all payouts and returned stakes - minus the total amount you wagered.
Make sure to use the total amount staked, not just your starting bankroll. For example, if you began with $1,000.00 but placed $10,000.00 worth of bets by recycling your bankroll, your denominator is $10,000.00. This method ensures you’re measuring efficiency for every dollar risked.
Patrick Cwiklinski, Sportsbook Expert at Sports Betting Dime, says: "Optimizing your betting strategy for ROI is the key to making money betting".
Let’s break this process into manageable steps.
Step-by-Step ROI Calculation
Here’s how to calculate ROI step by step:
- Add all wagers: Include every wager - wins, losses, pushes, and voids.
- Sum all payouts: Be sure to include returned stakes when calculating total returns.
- Subtract total wagers from total returns: This gives you your net profit (or loss).
- Divide net profit by total wagers and multiply by 100: This gives you your ROI percentage.
For example, say you placed $5,000.00 in total wagers and received $5,400.00 back. Your net profit would be $400.00. Using the formula, your ROI would be: ($400.00 / $5,000.00) × 100 = 8% ROI.
Industry benchmarks suggest that an ROI of 5–10% is considered "very good", while anything above 10% is "strong" but challenging to maintain over time.
Once you've calculated your overall ROI, it’s time to dig deeper by segmenting your data.
Segment ROI by Key Categories
While calculating a single ROI figure is helpful, breaking it down by categories like sport, bet type, or time period can provide valuable insights. For instance, separate calculations for moneyline bets versus spreads, or comparing ROI in the NFL against the NBA, can highlight where your strengths lie. If you find an ROI of +8% on straight bets but -15% on parlays, you’ve already identified an area for improvement.
Use your spreadsheet to set up comparison tables or charts. Track ROI by categories such as sport, league, bet type, time of day, or even day of the week. For meaningful results, aim to analyze at least 50 to 200 bets per category before drawing conclusions. Keeping your data consistent is crucial - stick to MM/DD/YYYY for dates, use a single odds format, and record all stakes in USD with two decimal places. This consistency reduces errors and simplifies your analysis.
Step 3: Analyze ROI with Advanced Metrics and Trends
Once you've broken down your ROI in Step 2, it's time to dive deeper with advanced metrics. A single ROI figure alone doesn’t tell you whether your performance is rooted in skill or just a streak of good fortune. Advanced metrics help separate the two, giving you a clearer picture of your betting strategy.
Break Down ROI by Metrics
Closing Line Value (CLV) is a key metric that measures how often you secure odds better than the final market price before the event begins. If you consistently beat the closing line, it’s a strong indicator of long-term profitability - even if your short-term ROI looks negative.
Expected ROI (xROI) takes luck out of the equation by estimating how often your bets should have won based on final scores rather than simple win/loss outcomes. For example, if a spread bet loses by just one point in overtime, xROI recalculates the result as if the game ended in regulation. This metric stabilizes faster than actual ROI, especially when working with a smaller number of bets.
Betting Yield measures your average profit per dollar wagered. Unlike overall ROI - which focuses on capital efficiency - yield lets you compare how different bet sizes perform. For instance, you can use yield to determine whether a $50 betting strategy outshines a $100 strategy on a per-unit basis.
To get even more insight, analyze performance by odds range. However, keep in mind that sample size is critical. Aim for at least 100 to 500 bets per category to ensure your conclusions are statistically reliable. Anything under 100 bets may not provide meaningful data.
From here, shift your focus to time-based trends and behavioral patterns to better understand variance.
Identify Trends and Variance
Building on your segmented ROI, look at how time and behavior influence your results. Break your ROI down by the day of the week, time of day, or season to uncover patterns. For example, you might find that your ROI drops on weekends due to impulsive live betting or that you perform better during the regular season compared to playoffs.
Psychological factors also play a huge role. Watch for behaviors like "Tilt", where you increase stakes abnormally after a loss, or "Over-betting", where ROI declines during periods of high-volume betting. Monitoring your maximum drawdown - the largest loss you've experienced - can reveal the level of risk in your strategy.
Finally, perform a level-stake comparison. Calculate what your ROI would look like if every bet had the same stake, then compare it to your actual ROI. If the level-stake ROI outperforms your current ROI, it may signal the need to adjust your bet sizing strategy.
Step 4: Tools for Historical ROI Analysis
To analyze trends effectively, it’s essential to use tools that simplify and speed up the process. Relying on manual tracking can lead to errors and consume a lot of time. Automated platforms offer a better solution by handling data collection and processing seamlessly. One standout option in this space is WagerProof.
Leverage WagerProof for Historical ROI Insights

WagerProof is designed to make ROI analysis straightforward, offering real-time data and detailed analytics. Its Edge Finder feature helps identify value bets by comparing live model calculations to sportsbook lines. This allows you to measure your betting edge before placing a wager. It also highlights mismatches in prediction markets, such as when public betting trends don’t align with model confidence. For instance, if the public heavily favors one side but the model shows a 37% discrepancy in spread confidence, the Edge Finder flags this opportunity.
The platform’s Historical Analytics tool breaks down performance by sport, bet type, or time period. This level of analysis helps you pinpoint where your strategy is thriving or falling short. Another standout feature, WagerBot Chat, acts as an AI assistant that explains line movements, betting percentages, and the reasoning behind predictions. It uses real-time and historical data to provide reliable insights.
Additionally, WagerProof offers a Bet Slip Grader, which evaluates uploaded bet slips to determine their quality, value, and potential outcomes based on historical data. This is particularly helpful for auditing past wagers and understanding why certain bets worked while others didn’t. The platform uses multiple predictive models to deliver unbiased, accurate insights. Together, these tools not only automate the analysis process but also provide clarity and actionable strategies.
Benefits of Using Pro-Level Tools
Efficient tools are crucial for refining an ROI-based betting strategy. The main advantage of automated tools like WagerProof lies in their ability to handle large volumes of data with speed and precision. Manual tracking, on the other hand, is limited in scope and prone to errors. For perspective, here’s how manual analysis stacks up against WagerProof:
| Feature | Manual Analysis | WagerProof (Automated) |
|---|---|---|
| Time Investment | High (30 minutes to several hours per game) | Low (Real-time processing) |
| Data Volume | Limited (10–15 metrics) | High (Thousands of data points) |
| Error Risk | High (Manual entry/typos) | Low (Automated data feeds) |
| Scalability | Low (Hard to track 50+ games) | High (Covers all major leagues simultaneously) |
| Decision Making | Prone to emotional bias | Objective, data-driven recommendations |
| Transparency | Full (User-created) | High (Multi-model consensus) |
WagerProof also enforces disciplined betting practices. For example, its Kelly Criterion methods calculate precise bet sizes, eliminating guesswork. The platform offers a Free Plan, which includes a demo of the Edge Finder and access to basic statistics and trends. Upgrading to the Premium Plan unlocks the full suite of tools, such as the AI Game Simulator, historical analytics, teaser optimization tools, and access to a private Discord community. For professional-level needs, the Enterprise Plan provides advanced analytics, custom integrations, and dedicated support.
To further improve ROI accuracy, it’s crucial to strip the vig - a process that calculates "fair odds" by removing the sportsbook’s margin. This ensures that your ROI calculations are realistic and not inflated. In a study analyzing 121,507 betting lines, using a Partial Kelly strategy with a 10% threshold delivered an 80% annual return over 11 years. This demonstrates the effectiveness of disciplined, data-driven betting.
Step 5: Interpret ROI Results and Refine Your Strategy
Benchmarking ROI Expectations
Setting clear and realistic ROI targets is crucial for long-term success in sports betting. For example, achieving an ROI of 5% over a large volume of bets is considered excellent. To put this into perspective, the stock market typically offers annual returns of 6–7%. This comparison highlights how even a modest positive ROI in sports betting can be competitive. However, sports betting requires consistency and discipline across a substantial number of wagers.
Understanding breakeven math is equally important. For instance, hitting a 53% win rate across 3,500 bets in a year could yield a 62% return on your bankroll. Even a slight improvement to a 52.5% win rate might still generate a 12% return. These figures demonstrate how small increases in accuracy can lead to meaningful profitability.
As betting analyst Joseph Buchdahl explains, "The longer the record, the more likely it is that a deviation from the expected outcome is due to something other than chance".
It's essential to avoid overreacting to short-term results. By keeping these benchmarks in mind, you can make data-driven adjustments to enhance your betting performance.
Adjusting Strategies Based on ROI
Once you've established benchmarks, use your historical ROI data to identify and refine underperforming strategies. For example, if your analysis shows that certain bet types - like parlays - consistently yield negative ROI, it might be worth reducing or eliminating those wagers altogether.
As Bet-Analytix Academy advises, "Better an average bettor who follows their data than an analysis genius who ignores their statistics".
Fine-tuning your approach can make a significant difference.
One effective strategy is line shopping across sportsbooks to secure even a half-point of extra value. This small step can improve your win percentage by 1–3% over the course of a season. Additionally, keeping an eye on Closing Line Value (CLV) is critical. Consistently beating the closing line is a strong indicator of long-term success. If you find positive CLV but negative ROI, it may simply reflect short-term variance.
Leverage segmented ROI data and CLV insights to allocate your bankroll toward high-value markets that consistently perform well. By using analytics to minimize the house edge, you could potentially boost your earnings by 5–10% per bet.
Conclusion
Analyzing historical ROI isn’t just about tallying wins and losses - it’s about measuring how effectively every dollar you risk is working for you. By focusing on ROI, you can evaluate the efficiency of each bet and improve your strategy with metrics like Expected ROI (xROI).
Bettors who rely on data-driven strategies consistently outperform casual bettors. Using the steps in this guide - organizing data, calculating segmented ROI, spotting trends, and fine-tuning your methods - you could potentially increase your profits by 5–10% per bet.
"Expected value is the truth serum for your bets – it reveals whether you're making a savvy play or donating to the sportsbook's coffers." - Jimmy Boyd, Boyd's Bets
Real-time tools make these insights even more actionable. WagerProof simplifies the process with features like live data, historical analytics, and automated outlier detection to highlight value bets. Unlike generic AI systems that depend on outdated information, WagerProof connects directly to live, verified sports data and delivers detailed edge analysis - offering transparency and smarter tools for betting.
Leverage these insights from your historical ROI analysis to continuously refine and optimize your betting strategy.
FAQs
How many bets are needed for ROI to be meaningful?
ROI in betting starts to hold real weight when you're working with a large sample size - think hundreds or even thousands of bets. When the sample size is small, luck can heavily influence results, making it hard to gauge true profitability. By analyzing a larger dataset, you minimize variance and gain a much clearer understanding of your long-term betting performance.
How should I handle pushes and void bets in ROI?
To get an accurate ROI calculation, make sure to leave out both pushes and void bets from your total wager count and profit calculations. Void bets are essentially canceled bets - they don't count as wins or losses. Similarly, pushes are considered no-action bets and are excluded as well. By doing this, your ROI will give a clear picture of your actual betting performance without being influenced by outcomes that didn’t result in either a win or a loss.
What does positive CLV but negative ROI mean?
Positive Customer Lifetime Value (CLV) but negative Return on Investment (ROI) suggests you’ve managed to outperform the market’s closing odds, which points to a positive expected value. However, the negative profitability likely stems from short-term factors like variance or a sample size that’s too small. These elements can obscure long-term success, even when your closing line value indicates strong potential.
Related Blog Posts
Ready to bet smarter?
WagerProof uses real data and advanced analytics to help you make informed betting decisions. Get access to professional-grade predictions for NFL, College Football, and more.
Get Started Free