
Behavioral Data in Sports Betting: Ultimate Guide
Behavioral data is a game-changer in sports betting. It focuses on bettor habits - like how often they place bets, their deposit patterns, and preferred bet types - rather than just on-field stats. By analyzing these trends, you can spot market biases, identify value bets, and improve your success rate.
Key Takeaways:
- What It Is: Behavioral data examines patterns in how bettors engage, such as live vs. pre-game bets or deposit frequency.
- Why It Matters: It helps uncover opportunities when odds are skewed by public perception, improving bet success rates by 15–20%.
- How to Use It: Combine it with tools like machine learning and real-time analysis to refine strategies and beat the market.
The article dives into practical ways to use this data, from tracking betting frequency to leveraging AI tools for better predictions. It’s about making smarter, data-driven decisions - not relying on instinct.
Why Most Sports Bettors Fail: Insights from a Betting Expert
Types of Behavioral Data Features
5 Key Behavioral Data Features in Sports Betting
Behavioral data offers a window into the actions and habits of bettors, providing key insights into patterns that can shape your betting strategy. By analyzing these metrics, you can better understand when public behavior creates opportunities and refine your approach accordingly. Here’s a closer look at three main categories of behavioral data worth monitoring.
Betting Frequency and Patterns
How often you place bets and the patterns behind them can reveal a lot about your betting habits. For instance, the number of cash wagers per active day is a solid indicator of betting behavior. Research highlights that frequency metrics are strong predictors of shifts in betting habits. Other critical data points include the number of active betting days relative to the age of your account and the average length of betting sessions. Sessions lasting over 100 minutes, for example, might suggest a move from calculated betting to more intense, impulsive activity. Keeping an eye on these trends can help you avoid falling into the trap of chasing losses.
Market and Bet Preferences
The types of bets you place and the timing of those wagers can offer insights into your overall strategy. One key metric is the proportion of in-play (live) bets compared to pre-game wagers. Live betting, which involves making multiple bets during a single event, often reflects a more aggressive and fast-paced approach. Another factor to consider is device preference. Bettors who favor mobile devices tend to exhibit higher levels of betting intensity. Timing also plays a role - placing more bets on Saturdays, for instance, might suggest a recreational bettor, while daily, high-frequency wagers point to a more serious approach. Together, these trends shed light on how and when bettors engage, highlighting risk and bankroll management tendencies.
Monetary Trends and Risk Indicators
Your financial habits in betting - like deposit and stake patterns - can reveal your risk tolerance and discipline. The volume and frequency of approved deposits per active day is a key measure of betting intensity. A sharp rise in the "slope" of deposits (indicating an increase over time) might signal chasing behavior or a loss of control. Another important metric is stake variability. A study from February 2005 involving 24,781 in-play sports bettors found that the standard deviation of daily average stakes was a key marker of high-intensity betting strategies. Monitoring this variability helps ensure you stick to your planned unit size, avoiding one of the most common pitfalls that can quickly deplete your bankroll. Understanding these financial trends is crucial for maintaining discipline and refining your strategy.
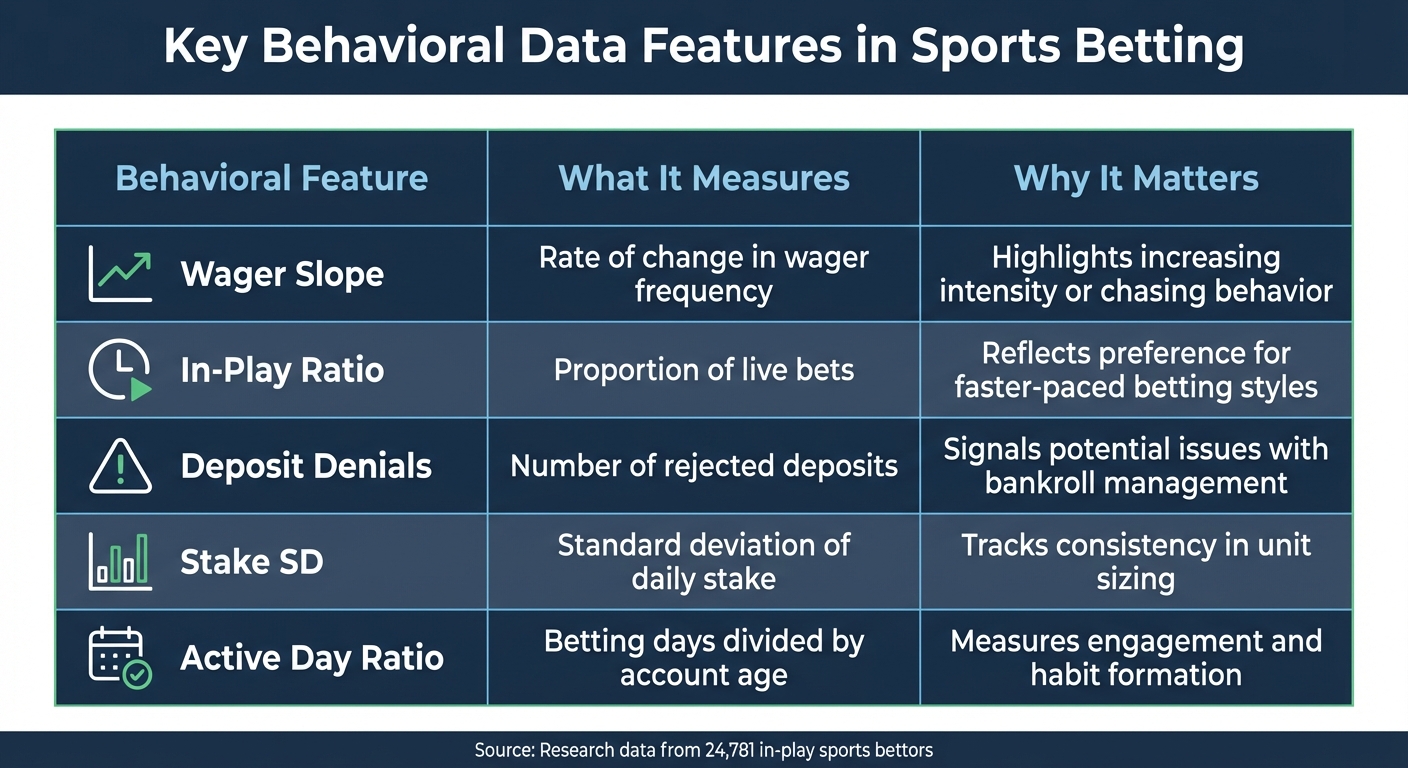
| Behavioral Feature | What It Measures | Why It Matters |
|---|---|---|
| Wager Slope | Rate of change in wager frequency | Highlights increasing intensity or chasing behavior |
| In-Play Ratio | Proportion of live bets | Reflects preference for faster-paced betting styles |
| Deposit Denials | Number of rejected deposits | Signals potential issues with bankroll management |
| Stake SD | Standard deviation of daily stake | Tracks consistency in unit sizing |
| Active Day Ratio | Betting days divided by account age | Measures engagement and habit formation |
Methods for Extracting and Analyzing Behavioral Data
Turning behavioral data into actionable insights can significantly enhance betting strategies. These methods focus on transforming raw data into precise signals that improve decision-making.
Data Aggregation and Feature Engineering
Feature engineering plays a critical role in uncovering patterns hidden within raw data. For example, using rolling averages from the last three to five games can provide a clearer picture of a team's current form. Ratios, like shots on target per goal, and tracking metrics such as odds movements over time, add depth to your analysis.
"Feature engineering for betting models is the secret weapon behind accurate sports predictions. By transforming raw data into meaningful insights, bettors can build smarter models that identify value and boost long-term profitability."
– Underdog Chance
A 2025 case study highlighted the power of engineered features. By factoring in metrics like average goal differential over the last five matches, changes in betting lines, and opponent away form, a soccer betting model improved its ROI from –2% to +7.5% over a 300-bet sample. Additionally, accuracy on Asian handicap bets rose by 12%. Models with well-engineered features have shown 10–25% better accuracy and ROI boosts of 15% or more.
Machine learning takes these engineered features to the next level, refining their predictive power.
Machine Learning and Clustering
Algorithms such as KNN, SVM, and Random Forest can segment betting data into categories like "normal", "warning", and "abnormal". Proper model calibration is key to aligning predicted probabilities with actual outcomes, especially when applying strategies like the Kelly Criterion.
In a 2024 study, researchers used AI to develop an anomaly detection system for K-League football matches, analyzing 2,607 data points spanning 2000–2020. By combining four models (SVM, RF, Logistic Regression, and KNN), they achieved over 92% accuracy in spotting abnormal matches and potential match-fixing. Interestingly, selecting models based on calibration rather than accuracy led to an average ROI of +34.69%, compared to –35.17% when accuracy alone drove the selection.
These methods are further enhanced by real-time data analysis for up-to-the-minute insights.
Real-Time Behavioral Analysis
Real-time systems monitor odds shifts, play-by-play events, and market dynamics, enabling bettors to identify anomalies like mismatched prediction spreads or abrupt changes in betting patterns.
Low latency is essential for staying ahead. Platforms use timestamped data to reduce risks from market drift. During volatile moments - like right after a goal - anti-latency failsafes can automatically cancel bets if the data is older than 1,500 milliseconds.
Tools like WagerProof's Edge Finder help identify outlier events and value bets by flagging mismatched spreads or sudden market shifts. By tracking metrics such as Live Execution Value (LEV) - the gap between your execution price and the mid-odds three seconds later - you can gauge whether your strategy consistently outpaces market adjustments.
Using Behavioral Data in Sports Betting Strategies
This section dives into how the behavioral trends discussed earlier can be turned into practical betting strategies.
Finding Value Bets with Behavioral Insights
Value betting is all about spotting opportunities where your estimated win probability is higher than what the odds suggest. For instance, if a team is listed at +150 (implied probability of 40%) but your model calculates a 45% chance of winning, you've uncovered an advantage.
Another key indicator is reverse line movement. This occurs when public bets heavily favor one side, but the betting line moves in the opposite direction - a strong signal of sharp money influence.
"The goal in sports betting isn't about winning every single wager - it's about consistently identifying edges and managing your bankroll wisely over time."
– WagerProof
Take -110 odds as an example. Since the break-even rate is 52.4%, a predicted win rate of 55% gives you a 2.6% edge. This small margin is crucial for long-term profitability, especially when accounting for the standard vig. Monitoring Closing Line Value (CLV) also helps confirm whether you're consistently finding an edge. Beating the final price before game time is often a hallmark of a solid betting strategy.
These behavioral insights serve as a foundation for integrating advanced AI tools to fine-tune betting approaches.
Combining Behavioral Data with AI Tools
AI tools take these insights further by streamlining real-time decision-making. They analyze behavioral trends at scale, exposing inefficiencies in the market. For instance, WagerProof's Edge Finder compares your model's fair price with live sportsbook odds, flagging opportunities with positive expected value (+EV). It also alerts you to mismatched prediction market spreads or books slow to react to breaking news, like injury updates or sharp money activity.
A study by Conor Walsh and Alok Joshi from the University of Bath in March 2023 highlighted the importance of model calibration over raw accuracy. Their research revealed that using a calibrated NBA betting model produced an ROI of +34.69%, compared to a -35.17% loss with an accuracy-focused approach. This underscores that the Kelly Criterion only works when paired with properly calibrated probabilities.
WagerProof's WagerBot Chat is another game-changer. This tool connects to live professional data, providing instant, data-backed answers to specific questions. Want to know how a team performs after rest days or how a player fares against zone defenses? WagerBot delivers insights rooted in real data.
AI-driven predictions that incorporate behavioral context and use calibrated models have been shown to improve betting success rates by 15–20%.
"Pros follow Billy Walters' rule: price over story. Set your fair number, then only bet when the market offers better value."
– Virginia Gandolfo, Action Network
Lastly, line shopping remains a must. Even small differences - like a half-point on a spread or a few cents on a moneyline - can add up significantly over hundreds of bets, emphasizing the importance of comparing odds across sportsbooks.
Conclusion
Behavioral data transforms sports betting into a calculated, data-driven approach. By analyzing factors like sports betting data analysis metrics, market preferences, and financial trends, you can uncover where public perception may falter and where sharp money is flowing. Studies show that data-driven models significantly outperform intuition-based betting strategies.
This shift from instinct to analytics reduces emotional decision-making and counters the lightning-fast adjustments sportsbooks make to odds - often in less than 10 milliseconds.
"Calibration prevents the overconfidence that burns bankrolls, offering a clearer picture of risk and reward."
– Adam Wickwire, OpticOdds Blog
With cutting-edge tools like WagerProof, bettors gain access to resources such as the Edge Finder, AI Game Simulator, and WagerBot Chat, which help identify anomalies and value bets automatically. The platform’s Discord community also fosters disciplined betting habits. These tools emphasize that leveraging behavioral insights and real-time data is essential for a comprehensive betting strategy.
The ultimate goal isn't about winning every bet - it’s about consistently finding value, managing your bankroll wisely, and tracking Closing Line Value. By using behavioral data effectively, you can tip the scales in your favor against the sportsbooks.
FAQs
How do I track my own behavioral betting data?
To keep a close eye on your betting habits, make it a point to record every wager in detail. Include key information like the sport, event, type of bet, odds, stake, and result. Tools like spreadsheets or dedicated bet tracking apps can make this process much easier. Be diligent - log each bet as soon as you place it, update the results promptly, and regularly review metrics such as ROI, win percentage, and CLV. This kind of consistent tracking can reveal patterns in your behavior and help you fine-tune your betting strategy over time.
What behavioral signals are the biggest red flags for chasing losses?
The biggest warning signs of chasing losses are emotional reactions, overreacting to recent results, and making impulsive decisions fueled by stress or excitement. These patterns often result in continuing to gamble with higher stakes, which only heightens the chances of even greater losses.
How can I combine behavioral data with CLV to validate an edge?
To effectively merge behavioral data with CLV (Customer Lifetime Value) and confirm an advantage, leverage market movements and final odds to assess how accurate your predictions are. Behavioral data can reveal consistent betting habits and outliers that reinforce your edge. Make it a habit to recalibrate your model using these insights, and monitor CLV across extensive samples to verify that your edge is both real and enduring.
Related Blog Posts
Ready to bet smarter?
WagerProof uses real data and advanced analytics to help you make informed betting decisions. Get access to professional-grade predictions for NFL, College Football, and more.
Get Started Free