
Checklist for Testing Long-Term Betting Edge Profitability
Finding a winning betting strategy is only half the battle. Proving it works over time is where the challenge lies. Variance can make bad strategies look good in the short term, so testing over at least 500 to 1,000 bets is critical. Here's a quick breakdown of how to test your betting edge:
- Track Everything: Record bet details like date, odds, stake, and outcomes. Use tools or spreadsheets to stay organized.
- Measure Key Metrics: Focus on ROI (3%-7% is ideal), Expected Value (EV), and Closing Line Value (CLV). These reveal if your strategy is profitable.
- Test for Significance: Use statistical methods like binomial tests to confirm your results aren’t just luck.
- Automate and Verify: Use tools to automate data collection and verify your edge against market benchmarks.
- Analyze Variance: Simulate outcomes to understand profit streaks and drawdowns. Adjust your criteria if needed.
- Scale Responsibly: Use methods like the Kelly Criterion to manage stakes without risking your bankroll.
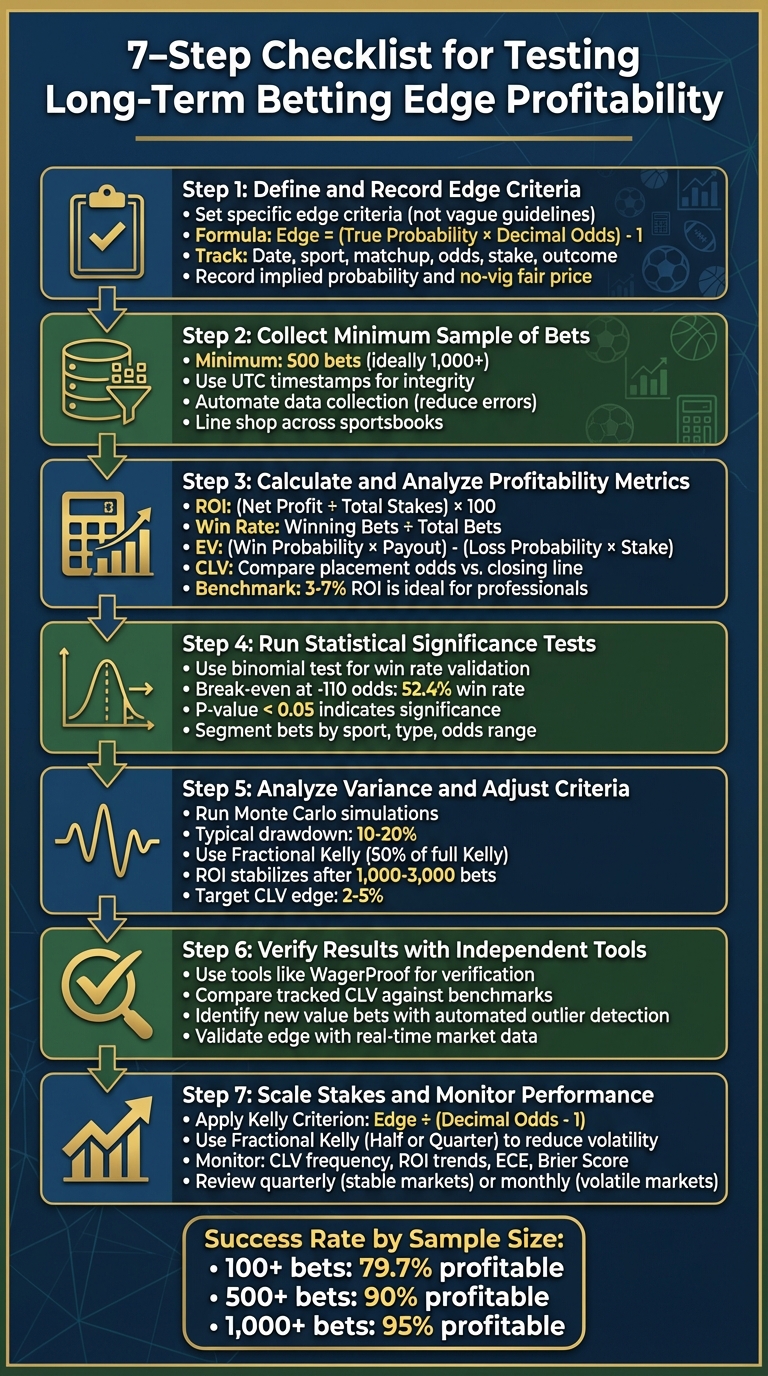
7-Step Checklist for Testing Long-Term Betting Edge Profitability
Step 1: Define and Record Edge Criteria
Setting Edge Criteria
Before placing any bet, it's crucial to establish specific edge criteria. Vague guidelines won't cut it. Instead, focus on clear, actionable parameters that signal when to bet. For instance, you may decide to place bets only when your model's estimated win probability is significantly higher than the bookmaker's no-vig fair market probability, or when there’s a notable gap between prediction market spreads and public betting percentages.
Here’s how you calculate edge: Edge = (True Probability × Decimal Odds) - 1. Let’s break it down with an example: if your model gives a team a 55% chance of winning (0.55 probability) and the odds are +150 (2.50 in decimal), the calculation would be (0.55 × 2.50) - 1 = 0.375. That’s a 37.5% edge, which is exceptionally high. In reality, most edges you'll find are smaller.
"Expected value is the truth serum for your bets – it reveals whether you're making a savvy play or donating to the sportsbook's coffers." - Jimmy Boyd, Boyd's Bets
After defining your criteria, make sure to document every bet. This helps you verify whether your edge holds up over time.
Tracking Bet Data
For effective analysis, track key details of every bet in a spreadsheet or database. Include information like:
- Date of the bet
- Sport and matchup
- Edge criteria that triggered the bet
- Placement and closing odds
- Stake amount
- Outcome of the bet
You can also go a step further by recording additional metrics such as implied probability and no-vig fair price. The no-vig fair price eliminates the bookmaker's margin, showing the "true" market probability. For example, if your model estimates a 65% win probability and the raw implied probability is 64.3%, the edge might seem small. But when compared to the no-vig fair price of 62.1%, the advantage becomes much more apparent.
How to Find Mathematically Profitable Bets with an "Edge"
Step 2: Collect a Minimum Sample of Bets
After defining your edge criteria and starting to track bets, the next step is to gather a sample large enough to reduce variance. Aim for at least 500 bets. This helps smooth out the natural ups and downs of short-term streaks. A handful of wins or losses doesn’t prove - or disprove - the validity of your model.
The key to success here is consistency. Applying your criteria without deviation ensures the test remains unbiased. As Oddsflow.ai explains: "A signal shouldn't be judged by one result. It should be judged by whether it was produced, logged, and evaluated in a way that survives scrutiny." To keep things disciplined, record each bet with a UTC timestamp before the event begins. This timestamping ensures integrity and creates a solid foundation for accurate data analysis.
Automating Data Collection
Relying on manual entry for data is risky - it’s prone to mistakes. Instead, consider tools like WagerProof, which can automatically pull in historical stats, predictions, and public betting trends. Automation not only saves time but also ensures your data remains consistent and free from human error. With automated systems in place, all bet details are logged seamlessly, setting you up for better analysis.
Line Shopping Across Sportsbooks
Once you’ve streamlined your data collection, take it a step further by comparing odds across different sportsbooks. Even a small improvement in odds can significantly impact your long-term profitability. Over the course of 500 bets, these minor differences in odds can add up, increasing your expected value and overall returns. Line shopping is a simple yet effective way to maximize your edge.
Step 3: Calculate and Analyze Profitability Metrics
Once you’ve built a sample of 500 or more bets, it’s time to dive into the numbers and assess your performance. A simple win-loss record won’t cut it. To get a complete picture, calculate metrics like ROI, win rate, EV, and CLV. Each of these provides a unique lens for evaluating your betting strategy.
Calculating Metrics
Start with ROI (Return on Investment), which measures your profit as a percentage of the total amount wagered. The formula is straightforward: divide your net profit by your total stakes, then multiply by 100. For example, if you’ve staked $10,000 and earned $10,300, your ROI is 3%. It’s a quick way to gauge overall profitability.
Next, calculate your win rate by dividing the number of winning bets by the total number of bets placed. While helpful, win rate on its own can be misleading - it doesn’t account for the quality of the odds you’re betting on.
For a deeper look, turn to Expected Value (EV). Use the formula: (Win Probability × Payout) - (Loss Probability × Stake). For instance, if you believe a team has a 55% chance of winning, but the odds suggest only a 50% chance, you’ve pinpointed positive EV - an indicator of long-term profitability.
Finally, track CLV (Closing Line Value). This metric compares the odds at which you placed your bet to the closing line odds. For example, if you bet at +150 and the line closes at +130, you’ve captured value before the market adjusted. Regularly tracking CLV across your bets can help confirm whether you’re consistently finding favorable opportunities.
Once these metrics are calculated, stack them against industry benchmarks to better understand the strength of your edge.
Benchmarking Results
Benchmarks are crucial for interpreting your metrics. For instance, professional bettors often aim for an ROI in the low single digits. Even an ROI of just 1–2%, sustained over thousands of bets, can indicate a legitimate edge.
Your win rate will vary depending on the odds you typically bet. For example, in spread betting at standard -110 odds, you’ll need a win rate of about 52.4% just to break even.
When it comes to EV, the goal is to maintain a consistently positive average EV per bet. A positive EV suggests your approach is built for long-term success, while a negative EV might mean the sportsbook’s margin is too steep to overcome.
As for CLV, consistently locking in bets at better odds than the closing line shows you’re identifying value early. On the other hand, if your CLV rarely turns positive, it could mean you’re entering bets too late, after the market has already adjusted. These benchmarks help you measure whether your strategy can beat the inherent sportsbook advantage and turn a profit over time.
Step 4: Run Statistical Significance Tests
Once you've calculated your profitability metrics, the next step is to test your win rate for statistical significance. This ensures that your observed success isn't just a fluke caused by random variance.
A positive ROI and an impressive win rate might seem encouraging, but statistical tests are the only way to confirm if your results are genuinely reliable.
Testing for Statistical Significance
One of the most effective tools for this is the binomial test. This method helps answer a crucial question: Is your observed win rate truly above the break-even threshold, or could it simply be the result of chance? For standard –110 odds, the break-even win rate is 52.4%. For instance, if you win 55% of 500 bets, the binomial test can determine if the 2.6% difference above 52.4% is statistically significant.
Here’s how it works: calculate the standard error to measure variability, determine the Z-score to see how far your win rate deviates from the break-even rate, and evaluate the p-value. A p-value below 0.05 indicates statistical significance. For example, a study of 317 Premier League bets placed between 2021 and 2023 using the "Fickle Football Fan Formula" showed a 5.51% ROI and a 53.94% win rate. However, the p-value was 0.1562 - well above the 0.05 threshold. Despite generating a $299.40 profit, the results suggested that the outcomes were likely due to random variance rather than a dependable edge.
For categorical data, you can also use the chi-square test. This helps identify which segments of your bets contribute most to profitability.
Analyzing Bet Segments
It’s a mistake to view all your bets as one uniform group. Instead, break them into segments based on factors like sport, bet type, consensus strength, or odds range. This kind of segmentation helps you see which parts of your strategy are working and which aren’t. For example, you might find that your edge holds steady in NBA spreads but fades in NFL totals, or that bets with high consensus outperform those with low consensus.
Step 5: Analyze Variance and Adjust Criteria
Using your recorded edge criteria, it's time to evaluate variance and ensure your strategy is built for long-term success. Even strategies with statistically sound edges aren't immune to variance. Profit streaks and drawdowns are inevitable, but the key is identifying whether fluctuations are just part of the natural randomness or a sign that your approach needs adjustment.
Modeling Variance with Simulations
Monte Carlo simulations are a powerful tool for assessing variance. By simulating thousands of possible outcomes for your wagers, you can determine if your actual drawdowns are within the expected range or if they point to deeper issues. For instance, a maximum drawdown of 10% to 20% is generally considered typical. However, if you're seeing drawdowns nearing 50% or more, it could signal a high-risk strategy or fundamental flaws.
To manage variance during testing, consider using Fractional Kelly staking at 50% of the full Kelly stake. This means halving your stake size compared to the full Kelly method, which helps smooth out volatility while still allowing for growth. Over time, ROI tends to stabilize after you’ve placed between 1,000 and 3,000 bets.
These simulations and adjustments help you determine whether your edge criteria need fine-tuning. Understanding variance is essential for making informed decisions about your strategy.
Refining Edge Criteria
If your metrics fall short or drawdowns exceed 20%, it’s time to tighten your edge criteria. This could mean narrowing the minimum probability gap, focusing on a more specific range of target odds, or increasing the consensus threshold. Once adjustments are made, test your revised criteria with a fresh sample of bets to confirm the changes are effective.
One key metric to monitor during this process is your Closing Line Value (CLV). A CLV edge of 2% to 5% is often a strong indicator of long-term profitability. Remember, the goal isn’t to achieve perfection - it’s to develop criteria that deliver consistent results within acceptable levels of variance.
Step 6: Verify Results with Independent Tools
Once you've refined your criteria and analyzed variances, the next step is to ensure your edge holds up under scrutiny. Verifying your results with independent tools helps eliminate bias and reduces the risk of overfitting. This process connects your self-tracked data with real-world market benchmarks.
Using WagerProof for Verification

WagerProof's WagerBot Chat simplifies the process of verifying your edge by using real-time data and plain-language analysis. For example, if you've been testing an NBA betting strategy - like betting on unders when public betting is 70% on the over - you might ask: "Analyze my edge of betting NBA unders when public is 70% on over, sample ROI 8% over 200 bets." The tool factors in live data, including pace stats, injury updates, and even weather conditions, to calculate expected value (EV) and compare your results to market benchmarks.
WagerBot not only validates your calculated edge but also ensures your historical data aligns with live EV calculations. This gives you confidence that your findings are grounded in reality. Additionally, you can compare your tracked Closing Line Value (CLV) against WagerProof's benchmarks to further validate your strategy.
Identifying New Value Bets
WagerProof doesn’t stop at verification - it also helps uncover fresh opportunities. Its automated outlier detection feature flags new value bets in real time. For instance, if the prediction market suggests a 55% win probability but a sportsbook offers +120 odds (implying a 45.5% probability), this creates a potential 10% edge worth exploring.
The platform’s Edge Finder tool takes things further by comparing aggregated models to market odds and highlighting discrepancies using z-scores. This tool is especially useful for spotting games where consensus models differ significantly from bookmaker lines. It also analyzes public money splits, identifying situations where sharp bettors are on one side while the public heavily favors the other. These insights not only validate your existing strategies but also open the door to new, profitable angles that align with your framework.
Step 7: Scale Stakes and Monitor Performance
Once you've validated your statistical edge and fine-tuned your criteria, the next step is scaling your bets effectively. This process requires a balance between ambition and caution.
Betting too aggressively can drain your bankroll during inevitable losing streaks. On the other hand, being overly cautious might mean missing out on potential profits. The solution lies in disciplined staking methods, paired with constant vigilance to ensure your edge remains intact.
Using the Kelly Criterion
The Kelly Criterion offers a way to calculate the ideal bet size based on your edge and the given odds. The formula is simple: divide your edge by (decimal odds minus one). For example, if you identify a 5% edge on a bet with +200 odds (3.00 in decimal), the Full Kelly calculation suggests wagering 2.5% of your bankroll. However, many professional bettors prefer a Fractional Kelly strategy - such as Half-Kelly or Quarter-Kelly - to reduce volatility while still capitalizing on their edge.
To recap, the Kelly formula aligns your stake size with your probability of winning relative to the odds offered.
Research involving 121,507 betting lines over 11 years found that a Partial Kelly strategy with a 10% threshold delivered an 80% annual return. This approach balances growth with risk management, offering a safer alternative to flat staking or Full Kelly betting. Keep in mind, though, that Kelly assumes your bets are independent. If you're betting on correlated outcomes - like a player prop and a team total in the same game - you should lower your stakes to avoid overexposure.
Monitoring Performance Regularly
With a staking strategy in place, the next step is to continuously track your performance and adapt to market changes.
Even the best betting edges can weaken over time as sportsbooks adjust lines or market conditions evolve. To stay ahead, focus on key metrics like CLV frequency, ROI trends, ECE, and Brier Score. For instance, if your bets beat the closing line less than 50% of the time or if your ECE exceeds 0.015, it’s a sign to reevaluate your edge criteria and model inputs.
In stable markets, review your performance quarterly; in more volatile markets, consider weekly or monthly reviews. If you notice consistent underperformance, it may be time to adjust your criteria, lower your stakes, or even pause betting until you identify and resolve the issue. This disciplined approach ensures that your betting strategy remains profitable and adaptable over time.
Conclusion
Testing and validating consensus-driven betting strategies is an ongoing effort that separates consistent success from mere luck. The seven-step checklist outlined here offers a structured approach to building solid strategies: setting clear edge criteria, gathering a sufficient sample size, calculating profitability metrics, conducting statistical tests, evaluating variance, verifying outcomes with independent tools, and scaling stakes responsibly.
The numbers back this up. Among bettors with at least 100 bets, only 79.7% show profit. That figure climbs to 90% with 500+ bets and reaches 95% at 1,000+ bets. However, common mistakes - like overlooking the impact of vig (a +200 bet needs a 34.5% win rate after adjusting to +190) or relying on limited sample sizes - can quickly drain your bankroll if your strategy isn’t sound. These figures highlight why real-time verification and transparency are so critical.
Transparency and verification are the backbone of a reliable strategy. Tools like WagerProof use AI to evaluate matchups around the clock, analyzing public betting trends, prediction markets, and statistics with over 50 adjustable parameters to deliver clear, actionable picks. Similarly, WagerBot incorporates factors like weather, injuries, and predictive models to offer recommendations based on expected value.
As markets shift and sportsbooks adapt, yesterday’s edge can vanish without warning. Regularly reviewing performance metrics - such as CLV frequency, ROI trends, ECE, and Brier Score - helps you stay ahead. If your bets are beating the closing line less than 50% of the time or your ECE exceeds 0.015, it’s a sign to reassess your criteria and refine your models.
This checklist works because it prioritizes discipline over instinct. By combining rigorous testing, statistical analysis, and tools that provide real-time data, you can create a strategy that evolves with the market. Instead of crumbling at the first challenge, your approach will grow stronger and more adaptable over time.
FAQs
How do I estimate my 'true probability' for EV calculations?
To calculate your 'true probability' for Expected Value (EV) assessments, it's important to align your win probability model with actual outcomes. Here's how you can do it:
- Gather reliable data: Start by collecting accurate and relevant data to build your model.
- Develop a predictive model: Use tools like logistic regression or machine learning algorithms to estimate probabilities.
- Validate your model: Apply calibration techniques, such as probability bins or reliability plots, to compare predicted probabilities with real-world results.
To maintain accuracy, recalibrate your model regularly using methods like Platt Scaling or Isotonic Regression. Keep an eye on metrics like the Brier Score and Log Loss, as they help measure how well your predictions align with actual outcomes. Regular updates and validation ensure your model stays reliable over time.
What should I do if my ROI is positive but my results aren’t statistically significant?
If your ROI shows a positive trend but lacks statistical significance, it’s worth digging deeper into additional metrics to ensure the results are trustworthy. Pay attention to calibration, log loss, and confidence intervals to rule out the possibility that your ROI is just a fluke.
You can also use techniques like cross-validation and backtesting to check if your results hold steady across different data samples. For added assurance, track metrics like Closing Line Value (CLV) and Rank Probability Scores (RPS). These can help validate your model’s performance while minimizing the role of randomness in your outcomes.
How can I tell whether a big drawdown is normal variance or a broken edge?
To figure out whether a big drawdown is just normal variance or a sign of a failing strategy, take a closer look at key metrics like ROI (Return on Investment), CLV (Closing Line Value), and win rate over time. Compare your current drawdown to past fluctuations and your expected profitability. If these metrics are still positive or fall within their expected ranges, the drawdown is probably just part of the usual ups and downs. However, if you notice sharp declines in these metrics, it might signal a deeper issue - a broken edge - that could require adjustments to your approach.
Related Blog Posts
Ready to bet smarter?
WagerProof uses real data and advanced analytics to help you make informed betting decisions. Get access to professional-grade predictions for NFL, College Football, and more.
Get Started Free