
Checklist for Evaluating Betting Model Scalability
To scale a betting model successfully, focus on these key areas:
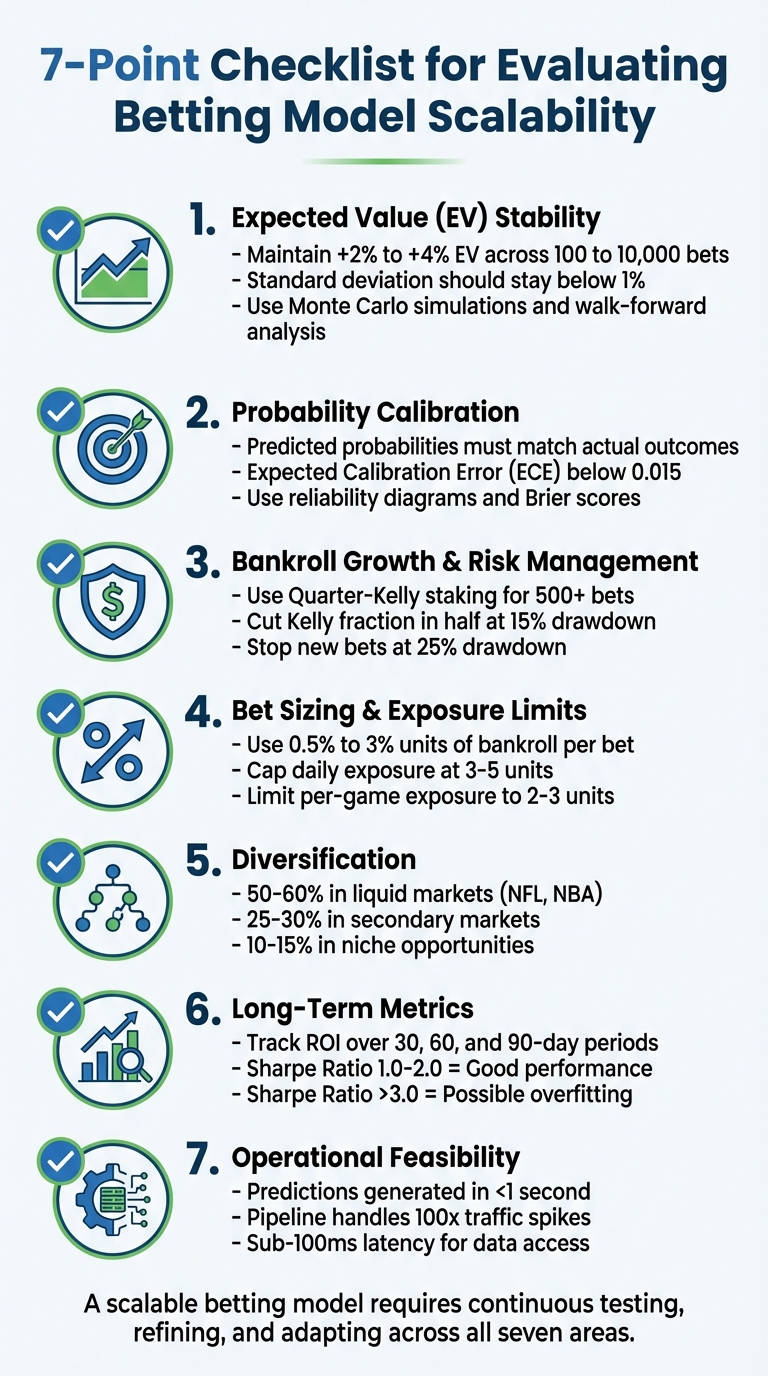
- Expected Value (EV) Stability: Ensure your EV remains consistent as you increase bet volumes. Use simulations, historical data, and walk-forward analysis to test this. For example, an EV drop from +4% at 100 bets to +1.5% at 10,000 bets signals issues.
- Probability Calibration: Your predicted probabilities should align with actual outcomes. Use reliability diagrams and metrics like Brier scores to check accuracy. Poor calibration can lead to overbetting or underbetting.
- Bankroll Growth and Risk Management: Simulate growth under various conditions and use conservative staking methods (e.g., Quarter-Kelly). Limit drawdowns by capping exposure and adjusting stakes during losing streaks.
- Bet Sizing and Exposure Limits: Use proportional units (e.g., 1% of bankroll per bet) and set daily/weekly exposure caps to avoid significant losses. Adjust stakes based on performance.
- Diversification: Test your model across multiple sports and bet types. Allocate bets strategically across major leagues, secondary markets, and niche opportunities to spread risk.
- Long-Term Metrics: Monitor ROI over time and track risk-adjusted returns using Sharpe ratios. A Sharpe ratio above 1.0 indicates consistent performance, while anything above 3.0 may suggest overfitting.
- Operational Feasibility: Ensure your model generates predictions quickly (under one second) and can handle high traffic during peak events. Build redundancy into your data pipeline to avoid disruptions.
7-Point Checklist for Evaluating Betting Model Scalability
Scaling a Professional Betting Operation | Circles Off Presented by Pinnacle Ep #114
1. Check Expected Value (EV) Stability
Ensuring EV stability is crucial for any betting model that aims to scale. If your EV diminishes significantly as you increase the number of wagers - from, say, 100 to 10,000 - it could indicate overfitting or hidden biases that only become apparent under real-world conditions. The core formula for EV is:
EV = (p × (odds - 1)) - (1 - p)
Here, p represents your model's predicted win probability. While a positive EV suggests you have an edge, that edge must remain consistent across thousands of bets to confirm the model's scalability.
Measure EV Across Different Bet Volumes
Start by testing your model's EV using Monte Carlo simulations. These simulations mimic thousands of bet sequences based on your model's probabilities and the actual odds. Test at various volumes, ranging from 100 to 10,000 bets. If the average EV drops from +4% at 100 bets to +1.5% or lower at 10,000 bets, your model likely isn't scalable. Pay attention to metrics like mean EV, standard deviation, and 95% confidence intervals. Ideally, the EV standard deviation should stay below 1%, and your Closing Line Value (CLV) should consistently remain above 0%.
To further validate, apply your model to historical data using rolling 100-bet windows. For instance, you could backtest NFL seasons from 2020 to 2025 by calculating EV for each subset of 100 bets. If the average EV remains above +2% without major decline, it indicates your model is generalizing well beyond its training data. Use walk-forward analysis for additional validation - train on Weeks 1–8 of NFL data, then test EV on Weeks 9–17, and repeat. A stable EV between +1.5% and +3% across 1,000+ bets is a strong indicator of consistency.
Account for Market Variability
Once EV stability is confirmed through simulations, it’s essential to evaluate how market factors impact your model's performance. Markets are dynamic - odds can shift (e.g., from 2.50 to 2.00 decimal), liquidity may drop for niche propositions, and the typical bookmaker hold (vig) of 4% to 6% can become more pronounced at higher volumes. To test robustness, break your data into segments based on market conditions. Compare high-liquidity NFL spreads to low-liquidity player props or group odds into ranges like 1.90 to 3.00 decimal. Recalculate EV for each segment and use Brier scores to check calibration. If your EV holds steady at around +2% across these scenarios, it shows your edge isn't limited to a specific market.
Keep an eye on how EV shifts with changing odds and market efficiencies. For example, if your model delivers +5% EV on 200 NBA bets but drops to -1% on 5,000 bets, it may be overfitting to sharp closing lines. To avoid this, set minimum edge thresholds (e.g., at least a 5% advantage), diversify your odds ranges, and ensure your out-of-sample ROI consistently exceeds 1% at scale.
Tools like WagerProof (https://wagerproof.bet) can help by providing real-time market data and advanced statistical models. These platforms can identify value bets and flag deviations in prediction market spreads - critical for maintaining EV stability as you scale. Successfully managing EV under various bet volumes and market conditions is key to building a scalable betting model.
2. Validate Probability Calibration
Once you've established stable EV metrics, the next step is ensuring your betting model delivers probabilities that are well-calibrated. Calibration means your predicted probabilities should match actual outcomes. For example, if your model predicts a 60% chance of winning for 100 bets, you should see about 60 wins. Poor calibration can lead to errors in bet sizing - either overbetting on non-existent advantages or underbetting on genuine opportunities.
Use Reliability Diagrams to Check Calibration
Reliability diagrams provide a clear, visual way to evaluate whether your predicted probabilities align with actual outcomes. Start by gathering a large dataset of predictions and results - ideally more than 1,000 bets. Divide predictions into fixed 10% bins. For each bin, calculate the average predicted probability and the observed win rate. Plot these values with predicted probabilities on the x-axis and observed win rates on the y-axis.
In a perfectly calibrated model, the points will align along a 45-degree diagonal line where predictions match outcomes. If the points fall below the diagonal, it indicates overconfidence; if they're above, it suggests underconfidence. An S-shaped curve often signals overconfidence at the extremes and underconfidence in the middle range. Pay attention to "mid-range inflation", where predictions in the middle consistently overestimate outcomes. To quantify calibration, track metrics like the Brier score (lower is better) and ensure the Expected Calibration Error (ECE) stays below 0.015 for a scalable model. You can also create sport-specific reliability curves for a more detailed analysis. Once you’ve identified calibration issues, use these insights to refine your model and confirm its accuracy with further testing.
Test Calibration with Walk-Forward Analysis
Walk-forward analysis mimics real-time betting conditions, allowing you to test your model on sequential, unseen data. Train your model on one season’s data, then test it on the following season using rolling windows to track calibration over time. Employ out-of-time splits, where the most recent data serves as a holdout set, and use KS tests to detect any calibration drift. Tools like WagerProof (https://wagerproof.bet) can be helpful here, providing real-time data feeds and statistical models to monitor calibration as market conditions change. Consistent calibration across multiple walk-forward tests is essential to maintaining accuracy as you scale up your betting volume.
3. Test Bankroll Growth with Risk Management
Once you've established EV stability and properly calibrated your model, the next step is ensuring your bankroll can handle scaled betting. This requires solid risk management to keep your betting sustainable. Even the best-calibrated model can fail if aggressive staking leads to massive losses. To scale your betting successfully, you need to focus on steady bankroll growth while minimizing the risk of significant drawdowns.
Simulate Bankroll Growth Scenarios
Monte Carlo simulations are a great way to test how your bankroll might perform under various conditions. By running thousands of trials, these simulations account for randomness and outcome variability, giving you a clearer picture of potential outcomes. To set up these simulations effectively, include key factors like odds dispersion, EV standard deviation, and autocorrelation.
Pay close attention to the 5% equity quantile to understand worst-case scenarios and determine the bankroll size you'll need. Use Fractional Kelly staking - such as Quarter-Kelly - to strike a balance between growth and risk. Many professionals stick with Quarter-Kelly until they've placed over 500 bets to confirm their edge. To avoid unnecessary losses from commission or calibration issues, only place bets with an expected value (EV) of 3% or higher.
Evaluate Risk of Drawdowns
After simulating growth, it's crucial to evaluate how your bankroll would hold up under tough conditions. Set specific drawdown triggers to manage risk: cut your Kelly fraction in half if you face a 15% drawdown, and stop placing new bet types if losses hit 25%.
To limit overall exposure, cap your risk - never stake more than 10% of your bankroll in a single league round or time period. Monitor your weekly profit and loss (PnL) volatility, and if it exceeds 4% of your bankroll, adjust your stake sizes accordingly. Divide your bankroll into three parts: an active float for day-to-day betting, a reserve buffer for emergencies, and a fund for future growth. This structure ensures you can handle normal fluctuations without jeopardizing your betting operation.
4. Verify Bet Sizing and Exposure Limits
Effective risk management starts with ensuring your bet sizes are carefully calculated. Even the most accurate model won’t protect you if your stakes are poorly managed.
Set Proportional Bet Sizes
Focus on units, not dollar amounts. A "unit" represents a set percentage of your total bankroll, typically ranging from 0.5% to 3%. This approach allows your stakes to adjust automatically as your bankroll grows or shrinks. When you're on a winning streak, your stakes increase. During a losing streak, they decrease to help preserve your funds.
Beginners should stick to Micro (0.5%–1.0%) or Conservative (1.0%–1.5%) unit sizes. Professionals often prefer Conservative units as they balance growth and stability over the long haul. If you’re using the Kelly Criterion, try Half-Kelly staking - betting 50% of the suggested Kelly amount. This method delivers about 75% of full Kelly's growth but with much less volatility. Once you’ve determined your unit size, focus on controlling overall exposure to further safeguard your bankroll.
Cap Daily and Weekly Exposure
Exposure limits help protect you from unexpected market shifts or prolonged losing streaks. Keep your total daily exposure between 3–5 units across all wagers. For individual games, limit your combined exposure to 2–3 units. These caps help minimize the impact of correlated losses.
For example, betting 5% per play could lead to a 34% bankroll drawdown after eight consecutive losses. In contrast, betting 2% per play would result in only a 15% drawdown. If your bankroll drops by 25%, reduce your unit size immediately and reassess your strategy. Resist the temptation to increase stakes to recover losses - stick to your proportional system to naturally adjust bet sizes during tough stretches.
5. Evaluate Multi-Sport and Bet-Type Diversification
Once you've established solid EV and risk management practices, the next step is diversification. Sticking to just one sport or bet type can leave your model vulnerable to market changes. Diversifying spreads out the risk and helps maintain steady bankroll performance, even when the market shifts.
Test Your Model Across Different Sports
A reliable model should work across multiple sports, not just one. Each sport has its own quirks - what works for football might fail miserably in hockey. Testing your model in different sports markets ensures it's adaptable and scalable.
Start with major leagues like the NFL and NBA to establish a strong base. Once you’ve gained confidence, branch out into secondary markets like the NHL or MLB. For even more variety, allocate around 10–15% of your focus to niche sports like UFC or tennis. These markets often have less efficient odds, creating more opportunities for value bets. This approach not only spreads risk but also keeps your model active year-round, filling the gaps during off-seasons. And as you diversify sports, don’t forget to diversify bet types too.
Balance Your Bet Types for Stability
Relying on just one kind of bet can limit your potential, so mix it up. Use a combination of moneylines, spreads, totals, and player props to create a well-rounded betting portfolio.
Here’s a good breakdown: dedicate 50–60% of your bets to liquid markets like major sports spreads, 25–30% to secondary markets, and 10–15% to higher-risk options like player props. This mix benefits from the "compensation effect", where gains in one area can help cover losses in another. Regularly reviewing and rebalancing this portfolio ensures smoother returns and supports growth over time.
Tools like WagerProof can help fine-tune your diversification strategy and confirm that your approach is scalable.
6. Monitor Long-Term Performance Metrics
After setting your diversification and risk management strategies in motion, the next step is keeping a close eye on long-term performance metrics. These metrics are the key to ensuring your model grows steadily over time. While diversification helps create stability, it’s the long-term metrics that reveal both profitability and efficiency when adjusted for risk.
Track ROI at Scaled Volumes
Return on Investment (ROI) is the cornerstone of profitability metrics - it tells you how much profit you're making for every dollar wagered. For your model to scale effectively, it needs to consistently deliver an ROI that justifies both the time and money you're investing. To stay on top of things, monitor ROI over rolling periods like 30, 60, or 90 days. This allows you to spot trends early. For instance, if short-term ROI starts to decline but long-term figures remain strong, it could mean the market is shifting or your model needs some fine-tuning. Catching these signals early prevents small issues from turning into major setbacks as your betting volume grows.
Calculate Sharpe Ratio for Risk-Adjusted Returns
While ROI is essential, it doesn’t show how smooth or bumpy your profit journey is. That’s where the Sharpe ratio steps in - it measures the returns you’re earning relative to the risk (or volatility) you're taking on. A higher Sharpe ratio means your profits are consistent, with fewer dramatic swings, which is critical as you scale up.
To calculate the Sharpe ratio, divide the average monthly return by the standard deviation of monthly returns. A ratio of 1.0 or higher is generally considered a solid benchmark. Models with ratios between 1.0 and 2.0 are typically reliable and scalable. However, if backtesting shows a Sharpe ratio above 3.0, it might indicate overfitting, and live results will likely settle closer to 1.0–1.5. Use rolling monthly windows to track this metric and ensure your model adapts to changing market conditions.
| Sharpe Ratio | Quality Interpretation |
|---|---|
| < 0.5 | Poor (High risk, low return) |
| 0.5 - 1.0 | Decent (Acceptable but not professional-grade) |
| 1.0 - 2.0 | Good (Standard for most professional strategies) |
| 2.0 - 3.0 | Excellent (Rare in live environments) |
| > 3.0 | Suspicious (Likely overfitted; verify with out-of-sample data) |
Using tools like WagerProof (https://wagerproof.bet) can simplify the process of tracking these metrics. Platforms like this pull real-time data, helping you monitor both ROI and risk-adjusted returns as your model scales. This ensures you're not just focused on short-term gains but are building a betting operation that’s stable and sustainable over the long haul. Together, these metrics provide the final checks to confirm your model is balancing profit and risk as your betting volumes grow.
7. Ensure Operational Feasibility
Once you've confirmed profitability and established risk controls, the next step is ensuring your model can operate efficiently at scale. A betting model might excel in theory, but if it can't deliver predictions quickly or handle peak loads without crashing, scaling it becomes a pipe dream. A strong infrastructure is the backbone of any scalable betting model, tying performance directly to your operational capabilities.
Benchmark Computational Speed
Speed is everything, especially for live betting. Your model needs to generate predictions in under one second per matchup to stay competitive. By 2026, mainstream outlets are expected to routinely report results from 10,000-simulation outputs. If your model requires that level of simulation for statistical accuracy, test it under real-world conditions. Don't just run one matchup at a time - simulate multiple games simultaneously to measure latency. If your system bogs down during busy times, like NFL Sundays or March Madness, scaling will be a challenge.
"In 2026, with mainstream outlets routinely reporting results from 10,000-simulation model outputs... these questions aren't optional - they shape readership, legal risk, and long-term credibility." - Researchers.Site
To streamline operations, use tools like Docker for consistent environments and maintain a semantic changelog (e.g., v1.0.0) to track updates and their impact on performance. Once prediction speeds are optimized, focus on ensuring your data pipeline can handle the load seamlessly.
Test Data Pipeline Reliability
Speed alone isn’t enough - you also need a reliable data pipeline to make the most of real-time opportunities. During peak periods, like the Super Bowl or playoff games, traffic can spike by up to 100x within minutes. If your pipeline fails during these critical moments, you lose the ability to place bets or adjust strategies on the fly.
To prevent this, build redundancy and fault tolerance into your system. Use streaming ingestion technologies like Apache Kafka or AWS Kinesis instead of batch processing for continuous, low-latency data flows. Implement circuit breakers to isolate API failures, and ensure your system can instantly switch to a backup data provider if the primary feed goes down.
Track data provenance with timestamps and feed versions (e.g., OddsAPI v2.1). This makes your pipeline reproducible and easier to troubleshoot when issues arise. Automate drift detection and daily reconciliations between predicted and observed outcomes to maintain operational accuracy. Use tools like Prometheus, Grafana, or Datadog to monitor ingestion lag, throughput, and error rates.
For ultra-fast data access, rely on in-memory storage solutions like Redis or Memcached, aiming for sub-100ms latency from event to application screen. Platforms like WagerProof (https://wagerproof.bet) can consolidate real-time data - covering prediction markets, historical stats, public bets, and statistical models - into one transparent interface. Pair this with tools like WagerBot Chat, which connects to live professional data, ensuring your decisions are based on accurate, up-to-date information rather than outdated or incorrect data.
When your infrastructure is solid and your data pipeline runs smoothly, scaling becomes less about survival and more about execution. The right setup ensures you're ready for the challenges of high-stakes, high-volume betting environments.
Conclusion
Scaling a betting model goes far beyond simply picking winning bets - it’s about creating a system that can sustain profitability, consistency, and efficiency as you ramp up betting volumes and branch out into new markets. The steps outlined here serve as a guide: ensure your expected value stays consistent and your probability calibration aligns predictions with actual outcomes.
Bankroll management and risk controls are non-negotiable. Simulating growth scenarios, assessing drawdown risks, and setting proportional bet sizes with defined exposure limits can safeguard your bankroll during inevitable rough patches. Diversifying across sports and bet types provides an additional safety net, distributing risk while testing if your edge holds firm in varied scenarios.
Operational efficiency is equally critical. Your model must deliver predictions in under a second and handle heavy traffic without faltering - especially during high-pressure events like playoffs or championship games. A reliable data pipeline with built-in redundancy ensures you’re prepared for these peak moments.
Incorporating advanced data tools strengthens your position even further. Real-time analysis and data clarity are essential for iterative improvements. Platforms like WagerProof bring together prediction markets, historical stats, public betting trends, and statistical models, helping you spot outliers and value bets effortlessly. Tools like WagerBot Chat integrate live professional data, offering informed, on-the-spot decision-making to meet the scalability benchmarks highlighted in this guide.
The key takeaway? Scalability isn’t a one-and-done achievement - it’s a continuous cycle of testing, refining, and adapting. Regularly revisit this checklist to catch potential issues early, and rely on the right tools to maintain your edge in the ever-evolving betting world.
FAQs
How many bets do I need to prove my edge scales?
To demonstrate that your edge is genuine, you need a large enough sample size - typically in the hundreds or even thousands of bets. Why? Because a bigger sample helps ensure your results are statistically sound and less swayed by random luck. The more bets you place, the clearer the picture of your model's true performance. Consistency across this large dataset is the ultimate test of its reliability.
What’s a good Brier score or ECE for a betting model?
A good Brier score means aiming for the lowest possible value, as this indicates better calibration of predictions. On the other hand, an Expected Calibration Error (ECE) close to zero shows that probabilities are well-aligned with actual outcomes. Together, these metrics are essential for evaluating how accurate and dependable your betting model's predictions are.
How do I set unit size and exposure caps without killing growth?
To manage growth while minimizing risk, consider using a percentage of your bankroll as your unit size - for example, 1%. This approach allows your bets to scale in proportion as your bankroll increases. It's also smart to set firm exposure limits, such as a maximum daily loss or a cap on total exposure per game. These safeguards help prevent significant setbacks.
Keep a detailed record of all your bets and review your performance regularly. This habit will help you fine-tune your stakes and limits, ensuring your betting strategy remains scalable while keeping your bankroll secure.
Related Blog Posts
Ready to bet smarter?
WagerProof uses real data and advanced analytics to help you make informed betting decisions. Get access to professional-grade predictions for NFL, College Football, and more.
Get Started Free