
5 Steps to Build a Data-Driven Betting Framework
If you want to stop relying on gut feelings and start making smarter bets, a data-driven framework is the way to go. By combining data analysis, predictive modeling, and disciplined bankroll management, you can turn betting into a calculated numbers game. Here’s a quick breakdown of the five steps:
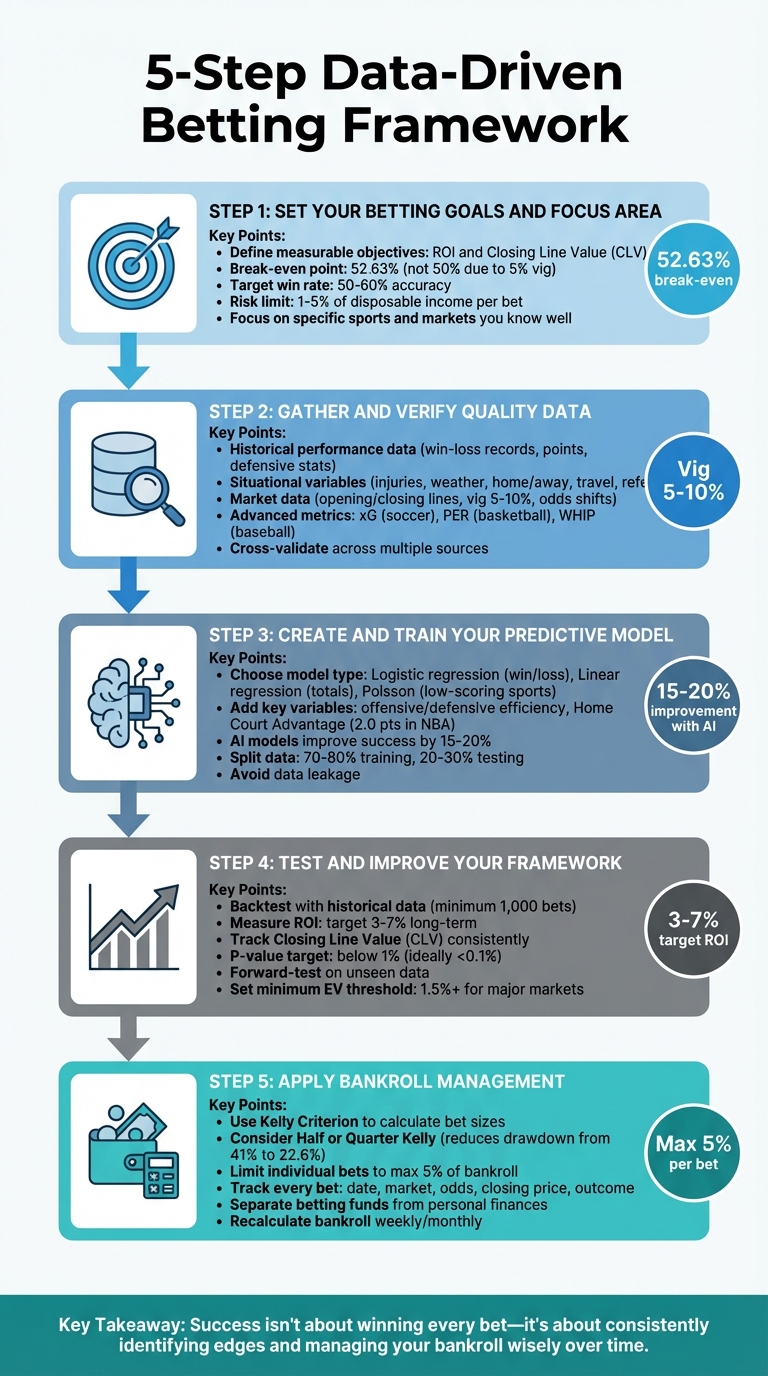
- Set Clear Goals: Define measurable objectives like ROI and Closing Line Value (CLV). Focus on specific sports and markets to avoid overstretching.
- Gather Quality Data: Collect historical stats, situational variables (e.g., injuries, weather), and market data. Verify accuracy across multiple sources.
- Build a Predictive Model: Use models like logistic regression or Poisson distribution depending on your betting goals. Start simple and add variables like efficiency ratings.
- Test and Refine: Backtest with historical data, measure performance metrics like ROI and CLV, and adjust based on results.
- Manage Your Bankroll: Use strategies like the Kelly Criterion to calculate bet sizes and minimize risks during losing streaks.
The key is consistency. Track every bet, stick to your strategy, and make decisions based on data - not emotion. This approach helps you find value in odds and maintain long-term profitability.
5-Step Data-Driven Betting Framework Process
Step 1: Set Your Betting Goals and Focus Area
Define Measurable Objectives
Before diving into data, take the time to outline what success looks like for you. Clearly defined, measurable goals help you stay focused and distinguish between luck and actual skill.
Two key metrics to track are Return on Investment (ROI) and Closing Line Value (CLV). ROI measures whether your strategy is profitable over time, while CLV compares the odds you secured when placing a bet to the final market odds before the game starts. If you consistently beat the closing line, it’s a strong sign that your bets are finding real value - even if some individual wagers lose.
Set a realistic win rate target. Keep in mind that the standard 5% vig means your break-even point isn’t 50% - it’s about 52.63%. To profit, you’ll need to win more than that. Most automated betting models aim for accuracy between 50% and 60%, and even a small edge, like 1%, can add up significantly over thousands of bets.
Establish limits on risk by wagering only 1–5% of your disposable income per bet. This approach protects your bankroll during inevitable losing streaks and ensures you can keep betting sustainably over the long haul.
Pick Your Sports and Markets
Once your goals are clear, focus on specific sports and markets where you have the best chance of gaining an edge.
Trying to bet on everything will stretch your resources too thin. Instead, narrow your efforts to sports and bet types you can analyze effectively.
Start with sports you know well. Familiarity with a sport gives you added context when interpreting data. For example, basketball (NBA) and baseball (MLB) are great choices because they offer daily updates to stats like efficiency and box scores, giving you a steady flow of data. On the other hand, sports like soccer and hockey, which are lower scoring, often require different modeling approaches, such as Poisson-style models, compared to high-scoring sports like basketball.
Begin with straightforward markets like 2-way moneylines or 3-way outcomes to establish a solid foundation. Once your baseline model is reliable, you can gradually expand to spreads, totals, or player props. For those willing to dig deeper, niche markets - like college basketball conference tournaments - can present opportunities if you’re prepared to research team dynamics and coaching strategies.
High-volume leagues, like the NBA with its 82-game seasons, offer more data to validate your models compared to leagues with shorter schedules, such as the NFL’s 17-game season.
Set Boundaries for Your Strategy
With your goals and focus areas defined, it’s essential to set firm boundaries to maintain discipline and avoid spreading yourself too thin.
Your strategy should align with how much time you can realistically dedicate and the return you’re aiming for. For instance, some markets release odds late at night or during work hours, which might clash with your personal or professional commitments. Choose an approach that fits seamlessly into your daily routines.
Decide between high-volume and high-yield strategies. High-volume approaches, which involve placing multiple bets per day with lower yields (2–3%), can grow your bankroll faster than high-yield strategies (10%) that only involve a few bets per week. Keep in mind that manual analysis usually caps out at 5–10 games per week, whereas automation allows for handling much higher volumes.
Set clear criteria for placing bets. For example, you might only bet when the expected value is above 1.5%, the market data is fresh (less than two minutes old), and at least 2–3 independent sportsbooks confirm the opportunity. These filters help you avoid overtrading on small edges.
Lastly, be aware that bookmakers may limit or ban accounts that consistently win. To counter this, consider spreading your activity across multiple platforms to avoid hitting account limits.
Step 2: Gather and Verify Quality Data
Determine What Data You Need
To build a reliable framework, you’ll need three main types of data. Start with historical performance data, which includes win-loss records, points scored and allowed, and defensive stats for both teams and individual players. These numbers form the backbone of your analysis, but they’re just the beginning.
Next, factor in situational variables that can sway outcomes. Keep tabs on injury updates, weather conditions (wind is particularly impactful for NFL passing games), home versus away records, travel schedules, and even referee assignments. For instance, strong winds can completely disrupt passing plays, yet this is often overlooked by casual bettors.
Finally, dig into market data, which often holds the key to finding value. Track opening and closing lines from multiple sportsbooks, note the vig (typically 5–10% of your wager), and monitor how odds shift leading up to game time. If you can consistently secure odds better than the closing line, you’re likely uncovering genuine opportunities.
Advanced metrics can also add depth to your analysis. For example, in soccer, Expected Goals (xG) provides a more accurate prediction of scoring chances than final scores. In basketball, Player Efficiency Rating (PER) gives a clearer picture of a player’s overall impact compared to just points per game. Baseball analysts often rely on WHIP to evaluate pitchers. One sports analyst even reported a 65% success rate by applying advanced statistical models to well-curated datasets.
Once you’ve outlined the data you need, the next step is finding platforms that make it easy to access this information.
Access Reliable Data Platforms
With your data requirements in mind, focus on finding platforms that deliver accurate and comprehensive information. In the past, this often meant costly subscriptions or manually scraping data. Now, tools like WagerProof simplify the process by offering everything in one place - prediction markets, historical stats, public betting trends, and statistical models. Its Edge Finder highlights consensus-driven opportunities, while the AI Game Simulator runs thousands of scenarios to pinpoint bets you might overlook.
For sport-specific data, platforms like FBref (soccer), Basketball-Reference, and official league sites such as NBA.com or NFL Next Gen Stats provide reliable historical stats.
When choosing a platform, prioritize tools that offer speed and real-time updates. This is especially critical for live betting, where momentum changes and last-minute injury news can shift the odds. Also, make sure the platform supports your specific markets. For instance, NFL player props are usually available 72 to 96 hours before kickoff, while College Basketball props might only appear 24 hours before tip-off.
Check Data Quality and Consistency
Before plugging data into your predictive model, ensure it’s accurate and consistent. Start with cross-validation by comparing stats for the same game across multiple sources. If one provider’s possession stats or shot counts differ significantly, investigate further or exclude that source.
Standardize team names to avoid merge errors. For example, map variations like "Man City", "Manchester City", and "MCFC" to a single identifier. This simple step prevents your model from treating one team as three separate entities.
Validate your data by cross-checking stats, ensuring probabilities in two-way markets add up to about 1.0 after accounting for the vig, and flagging outliers that deviate more than 10–12% from market consensus. Additionally, timestamp each data import with both the provider’s time and your own ingest time. If American odds like +110 and -110 don’t correctly convert to their decimal equivalents, it’s a sign your odds conversion formula needs fixing.
Step 3: Create and Train Your Predictive Model
Choose a Model Type
The first step in building your predictive model is deciding on the type of model that fits your goal and expertise. For predicting win/loss outcomes, such as moneyline bets, logistic regression is a great starting point. It’s straightforward, easy to interpret, and widely used for binary predictions. If your focus is on predicting point totals or margins, linear regression might be a better choice.
For sports like soccer or hockey, where scoring is lower, a Poisson distribution can be particularly effective because it’s designed to predict specific goal counts. Another option is using Elo-style team rating models, which calculate power ratings and convert them into win probabilities. If you’re experienced with tools like Python or R and have access to extensive datasets, advanced machine learning models like Random Forest or Neural Networks can handle more complex relationships. Keep in mind, though, these require a deeper technical understanding.
"What you're essentially trying to do with a betting model... is create an independent point of reference from which you can ascertain the probability of all possible outcomes." - BettingExpert Academy
It’s wise to start with simpler models before moving on to more advanced techniques. AI-driven models have been shown to improve betting success rates by 15% to 20%, but only if you avoid overfitting. To keep your model effective and manageable, focus on including only the most relevant variables.
Add the Right Variables and Metrics
Once you’ve chosen your model, the next step is selecting variables that will make it accurate and reliable. High-impact predictors like offensive and defensive efficiency ratings are usually dependable. Add additional variables only if they improve performance on unseen data. Don’t forget to include Home Court Advantage (HCA) - in basketball, for example, HCA is often estimated at 2.0 points. For NFL games, regression analysis shows that passing efficiency can be a major factor in outcomes.
A great example of variable selection in action comes from March 2019, when data scientist Tuan Doan built a Poisson process model for English Premier League matches. During its first test in Matchweek 1, the model correctly predicted 7 out of 10 results, including three exact scorelines, by accounting for the randomness inherent in soccer.
"A bad model can be refined into a good one. If you don't have any model at all, you have nothing to improve upon." - 8rainbets
To avoid misleading results, exclude market odds and post-game stats from your model. Including these can lead to "data leakage", where your model appears perfect in testing but fails in real-world scenarios. When training your model, split your data into 70–80% for training and 20–30% for testing. This ensures your model learns meaningful patterns rather than memorizing irrelevant details.
Run Initial Performance Tests
Once your model is trained, it’s time to evaluate how well it performs. Use metrics like the Brier Score or Log Loss to measure the accuracy of your probability predictions. Lower scores on these metrics indicate better performance. Avoid focusing solely on the win rate - a model that’s correct 55% of the time but consistently overestimates probabilities could still lose money.
To check how well your model is calibrated, group predictions into bins (e.g., games with a 50–55% predicted win probability) and compare the average predicted probability to the actual win rate. Another important measure is Closing Line Value (CLV). Compare your model’s predictions to the final market odds - if your model consistently beats the closing line, that’s a strong indicator of a long-term edge.
Automated AI tools tend to achieve prediction accuracy rates between 50% and 60%. For a successful betting model, aim for a long-term ROI in the range of 3% to 7%. Keep in mind that reliable results require a sample size of at least 1,000 bets - short-term fluctuations are not a reliable measure of success.
Step 4: Test and Improve Your Framework
Run Backtests with Historical Data
After building your model, the next logical step is to simulate how it would have performed in the past. This process, known as backtesting, helps you distinguish actual skill from mere luck. To do this, split your historical data into two sets: one for training (70–80%) and another for testing (20–30%).
Once you've run your backtest, take it further by performing a forward-test on fresh, unseen data. This step ensures your model isn't overfitting - basically, memorizing patterns that won't hold up in real-world scenarios. For instance, in November 2020, Miguel Figueres used the Betaminic tool to evaluate a "Home Revenge" strategy across 73,009 matches spanning 2016 to 2020. The analysis revealed 719 bets with a profit of 55 units and a yield of 7.66%. However, the p-value was 7.427%, showing that the results weren't statistically strong enough to rule out luck.
"If you don't know how to test your betting system, you're flying blind." - Fermín Visier
It's worth noting that even a system with a negative yield of -4% can occasionally show a profit 30.82% of the time due to variance. For a more reliable evaluation, aim for a sample size of at least 1,000 bets.
Your backtesting outcomes will serve as the foundation for analyzing key performance metrics.
Measure Performance Metrics
With your simulated performance data ready, it's time to focus on metrics that matter. Start with Return on Investment (ROI), which is the primary indicator of profitability. A well-performing model typically targets an ROI of 3% to 7% over the long term. However, ROI alone doesn't give you the full picture. Another critical measure is Closing Line Value (CLV) - this compares the odds you bet at to the final market price before the game starts. Beating the closing line consistently is a strong signal that your model has a genuine edge, even if short-term results are underwhelming.
"Across the board, there is no one smarter than the market. No One. More specifically, the market when it closes." - Fermín Visier
You should also pay attention to the p-value, which calculates the likelihood that your results are due to random chance. To ensure your strategy isn't just lucky, aim for a p-value below 1%, or ideally under 0.1%. Other important metrics include yield (profit as a percentage of total wagered) and drawdown (the largest drop from a peak to a trough), which help you assess risk and determine if your bankroll can handle potential losses.
These metrics not only validate your model but also highlight areas for improvement.
Adjust Based on Test Results
If your model consistently falls short of beating the closing line, it may be time to refine your approach. For example, in June 2025, a bettor using a soccer predictive model found they were breaking even after 600 bets. Upon realizing the model was missing CLV by 0.10 odds points, they added variables like injury reports and weather data. This adjustment boosted the model's ROI from 0% to 4.2% over the next 1,200 bets.
To further improve your framework, set minimum Expected Value (EV) thresholds for placing bets - typically 1.5% or higher for major markets, and even higher for smaller leagues with more volatile lines. You can also run comparative tests by operating two slightly different versions of your model simultaneously to see which one performs better in live market conditions. Always compare backtesting results to forward-test outcomes to identify overfitting issues, and prioritize CLV over short-term win rates when making adjustments.
Step 5: Apply Bankroll Management and Betting Rules
Calculate Bet Sizes with the Kelly Criterion
Once you have a reliable model in place, managing your bankroll wisely is key to staying in the game for the long haul. When your model identifies a favorable betting opportunity, the Kelly Criterion can help determine the ideal bet size. The formula looks like this:
f* = (b × p − q) / b
Here’s what the variables mean:
- f*: The fraction of your bankroll to wager
- b: The net decimal odds (decimal odds minus 1)
- p: Your model's probability of winning
- q: The probability of losing (1 − p)
If the result is positive, you’ve got a bet worth considering. If it’s zero or negative, it’s best to skip that wager altogether.
Keep in mind, though, that the Kelly Criterion is extremely sensitive to your probability estimates. Even small errors can wreak havoc on your bankroll. For instance, using the Full Kelly strategy on even-money bets with a 55% win probability could lead to a 41% drawdown after just five consecutive losses. To reduce this risk, many bettors opt for a fractional approach, like Half or Quarter Kelly, which significantly lowers the drawdown - down to approximately 22.6% under similar conditions. Additionally, it’s a good idea to limit individual bets to no more than 5% of your total bankroll.
"Kelly tells you the exact amount for each bet to maximize long-term growth. It prevents you from betting too much and going broke." - APWin
Create a System for Finding Value Bets
Value betting is all about finding opportunities where your model’s estimated probability is higher than the bookmaker’s implied probability. To start, convert all odds to decimal format, then strip out the bookmaker’s margin (the "vig") to calculate the market’s fair probability. Once you have that, use the Expected Value (EV) formula:
EV = (Probability_Model × Profit_Potential) − (Probability_Loss × Stake).
Set a minimum EV threshold to filter out weak bets. For major markets, a threshold of 1–2% is common, while for smaller or more volatile leagues, you might aim for 5% or higher. This approach helps you zero in on bets with solid long-term profit potential. Tools like WagerProof can be a game-changer here, flagging value bets in real time by identifying market discrepancies or shifts in closing line probabilities.
"Winning long-term isn't about 'hot picks.' It's about price. If you can routinely buy +110 when the fair price is +102, you're capturing positive expected value (EV)." - Betpera
Track Results and Make Adjustments
Keeping detailed records is the backbone of a successful betting strategy. For every bet, log details like the date, market, odds, closing price, your model’s probability, and the outcome. This data isn’t just for bookkeeping - it’s your feedback loop for improving your model and adjusting your approach.
Pay close attention to metrics like ROI and drawdown to ensure your bankroll can withstand inevitable losing streaks. Keep betting funds separate from your personal finances, and periodically recalculate your bankroll (weekly or monthly) to stay grounded and avoid emotional decisions. This disciplined approach to tracking and refining your strategy is what transforms a betting framework into a consistent, profitable system.
From $0 to $1,000,000: How I Started Profitable, Data-Driven Sports Betting (Step by Step Tutorial)
Conclusion
Creating a data-driven betting framework isn’t about relying on gut feelings or chasing tips - it’s about developing a structured process that transforms raw data into well-informed decisions. Think of it as a continuous learning loop: you define clear goals, gather reliable data, build predictive models, rigorously test your strategies, and manage your bankroll with discipline. Each step reinforces the others, turning betting from a game of chance into a data-backed strategy.
This approach delivers measurable outcomes. For instance, AI-driven predictions can improve success rates by 15–20%. However, even with a 53.75% strike rate, poor bankroll management can still lead to losses. That’s why a systematic strategy is essential - it helps you find value in the data while maintaining discipline to handle the ups and downs.
"The goal in sports betting isn't about winning every single wager - it's about consistently identifying edges and managing your bankroll wisely over time." - WagerProof
Getting started is straightforward. Begin with a sport or league you’re familiar with, and use a mix of automation and manual analysis to spot high-value opportunities. Tools like WagerProof simplify this process by offering features such as the Edge Finder, which highlights mispriced odds; the AI Game Simulator, which runs thousands of match scenarios; and WagerBot Chat, which provides real-time stats in an easy-to-understand format. By using a multi-model consensus approach, WagerProof ensures transparency, showing the math behind its recommendations rather than leaving you guessing.
You can start exploring WagerProof’s free plan to see how these data-driven insights work in action. As you refine your approach, scale up and stay consistent - track every bet, measure closing line value, and make adjustments based on data, not emotion.
FAQs
How can I choose the right sports and markets for my betting strategy?
To craft a solid betting strategy, start by focusing on sports and markets where your knowledge and experience shine. Major leagues like the NFL, NBA, and MLB are great options because they offer higher liquidity and more stable odds. These leagues also come with a wealth of data and consistent trends, making analysis more straightforward.
If you’re deeply familiar with a particular sport, like college basketball or international soccer, use that expertise to spot value bets and grasp the key factors that can influence outcomes. While smaller or niche markets might look tempting, they often come with lower liquidity and greater volatility, which can be tricky to navigate, especially for newer bettors. The key is finding a balance between your expertise and markets that provide reliable data and stability, helping you build a smarter, data-driven approach.
What are the most important types of data for creating a reliable predictive betting model?
To create a dependable predictive betting model, you need to focus on key data types that improve precision and help spot value bets. These critical data points include:
- Player and team performance stats: Keep track of details like recent form, scoring averages, and defensive performance.
- Historical trends: Examine past matchups, season patterns, and head-to-head statistics to identify recurring outcomes.
- Situational factors: Account for elements such as weather conditions, travel demands, and the impact of home-field advantage.
- Injury reports: Monitor player availability and fitness updates to understand how they might influence outcomes.
- Real-time updates: Use live data to refine predictions as fresh information becomes available.
By integrating these components, you can establish a data-driven approach that evaluates probabilities more effectively and uncovers smarter betting opportunities.
What are the best strategies for managing your bankroll in sports betting?
To keep your bankroll in check and reduce risks in sports betting, it’s essential to stick to disciplined strategies that safeguard your funds while aiming for long-term success. Start by setting a dedicated budget for betting - only use money you can afford to lose. It’s also smart to keep your bet sizes consistent, typically between 1% and 5% of your total bankroll per wager. This approach helps control risk and prevents major losses.
Another key step is tracking your bets. Maintaining a record of your wagers allows you to spot trends, assess your performance, and make informed adjustments as needed. Whatever you do, avoid chasing losses by impulsively increasing your bet sizes after a losing streak. This habit can often spiral into even greater losses. Instead, stay focused and stick to the plan you’ve set.
Tools like WagerProof can be incredibly helpful for making smarter, data-driven decisions. They can pinpoint value bets and offer insights into your betting habits. By staying informed and following a well-thought-out strategy, you can manage your bankroll more responsibly and improve your overall results.
Related Blog Posts
Ready to bet smarter?
WagerProof uses real data and advanced analytics to help you make informed betting decisions. Get access to professional-grade predictions for NFL, College Football, and more.
Get Started Free