
How to Handle Concept Drift in Betting Models
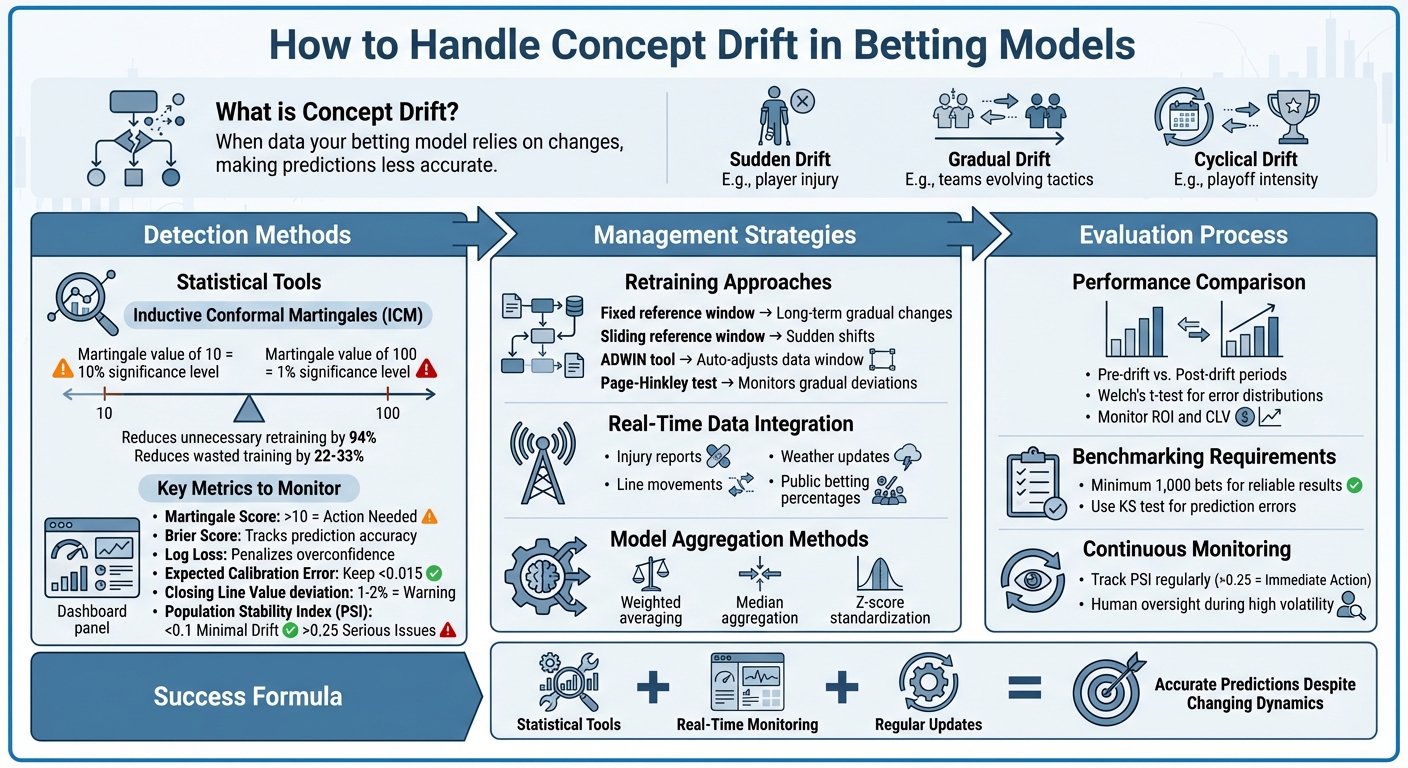
Concept drift is when the data your betting model relies on changes, making your predictions less accurate. This can happen suddenly (e.g., a player injury), gradually (e.g., teams evolving tactics), or cyclically (e.g., playoff intensity). Ignoring it means your model will lose its edge and profitability.
Key Takeaways:
- Detect Drift Early: Use tools like Inductive Conformal Martingales (ICM) and monitor metrics like martingale scores, Brier Score, and Closing Line Value (CLV).
- Retrain Models: Adjust models with fresh data using fixed or sliding windows and tools like ADWIN or the Page-Hinkley test.
- Leverage Real-Time Data: Integrate live updates such as injuries, weather, and line movements to stay relevant.
- Build Resilient Models: Use multiple models with methods like weighted averaging or median aggregation to handle shifts effectively.
- Monitor Performance: Compare pre- and post-drift metrics (e.g., Population Stability Index) to ensure recovery.
By combining statistical tools, real-time monitoring, and regular updates, you can maintain accurate predictions even as betting dynamics change.
Complete Guide to Detecting and Managing Concept Drift in Betting Models
Using inductive conformal martingales for addressing concept drift in data stream classification
How to Detect Concept Drift in Betting Data
Spotting drift early is the difference between staying ahead or falling behind. To keep adaptive models performing well, you need reliable methods to identify changes before they erode your advantage. Statistical tools and continuous monitoring can help you catch drift right when it starts.
Statistical Methods for Drift Detection
Inductive Conformal Martingales (ICM) offer a robust way to detect drift without relying on specific data distributions. This method evaluates whether your incoming betting data aligns with your training data by generating a sequence of p-values for each new instance. If the data distribution shifts, these p-values fluctuate, and a martingale score is calculated to flag changes.
Here’s how it works: a martingale value of 10 signals potential instability at a 10% significance level, while a value of 100 strongly indicates drift at a 1% level. One major perk? ICM can cut unnecessary retraining by up to 94% and reduce wasted training instances by 22%–33%.
The "Cautious" betting function stands out because it avoids betting during stable periods without evidence of change. This prevents the martingale value from dropping to zero, keeping your detection system ready to respond as soon as drift arises. Pairing these statistical tools with ongoing monitoring ensures your models stay accurate.
Monitoring Betting Data Streams
While statistical methods quantify drift, real-time monitoring pinpoints its impact on your data streams. This involves tracking your betting data as it arrives - game by game, bet by bet. Applying ICM to live data streams lets you continuously test the Exchangeability Assumption. If your martingale score jumps, it’s a clear sign that the underlying patterns have shifted.
An ensemble of classifiers can add another layer of protection. By using multiple classifiers, each with its own ICM, you create a backup system. If one model misses a change, others in the ensemble can still detect it, keeping your overall accuracy intact.
Key Metrics for Drift Detection
The martingale score is your primary alert system - values above 10 indicate serious distribution shifts that need immediate action. Beyond that, several other metrics help you gauge model performance:
- Brier Score: Tracks how well your probability predictions align with reality. An increase suggests your model is losing calibration.
- Log Loss: Penalizes overconfidence in predictions. Sudden spikes indicate your model is struggling with outcomes it was once confident about.
- Expected Calibration Error (ECE): Measures average calibration error across predictions. Keep this below 0.015; higher values mean recalibration is necessary.
- Closing Line Value (CLV) deviation: Compares your model’s predictions to market closing odds. A consistent 1%–2% deviation signals your model may no longer align with market efficiency.
How to Manage Concept Drift
Keeping your betting models up-to-date is essential for maintaining accuracy. If your models don’t adapt to changing conditions, their performance will decline over time, costing you your edge.
Adaptive Model Retraining
When you notice drift and have enough fresh data, retraining your models is key. The choice of your reference window plays a big role here:
- A fixed reference window compares current data to your original training set, making it useful for spotting long-term, gradual changes.
- A sliding reference window focuses on the most recent data, allowing you to catch sudden shifts more quickly.
Tools like ADWIN (Adaptive Windowing) can simplify this process by automatically adjusting the size of your data window. When ADWIN detects a statistical shift in performance, it discards outdated data that no longer reflects current trends.
For sudden changes - like a star quarterback getting injured mid-season - you’ll need to test and retrain your model immediately. On the other hand, gradual shifts, such as teams refining their strategies over time, are better addressed with incremental updates. The Page-Hinkley test is particularly useful here, as it monitors cumulative deviations in performance and flags when gradual changes become significant.
To keep up with new trends, integrate fresh data into your models immediately after retraining.
Incorporating Real-Time Data
Sometimes, outcomes take time to materialize. In these cases, unsupervised monitoring can help you track shifts in your model’s inputs or predictions. For example, the Kolmogorov-Smirnov (KS) test compares your current "detection window" to a "reference window" to identify changes.
Real-time data integration is another way to ensure your models stay relevant. Factors like injury reports, weather updates, and line movements often signal shifts that your model should account for. The faster you incorporate these signals, the better you can mitigate drift. Platforms such as WagerProof provide live data streams - like prediction markets, public betting percentages, and statistical models - that feed directly into your monitoring system. This allows you to identify and address drift as it happens, rather than reacting after the damage is done.
By combining real-time data with adaptable modeling techniques, you can build a more robust system.
Building Flexible Betting Models
To handle both sudden shocks and gradual changes, resilient models are a must. One approach is to run multiple models at the same time and aggregate their predictions. Here are a few ways to combine their outputs:
- Weighted averaging: Gives more weight to models that have been performing well recently.
- Median aggregation: Helps filter out extreme predictions that might indicate a model struggling with drift.
- Z-score standardization: Adjusts for variance across different models.
However, there’s a trade-off to consider: simplicity versus adaptability. A single model is easier to manage but more prone to drift. On the other hand, a multi-model system offers redundancy and flexibility, though it requires more resources and careful management. Your choice should depend on your available tools and how quickly conditions tend to change in your betting markets.
How to Evaluate Model Performance After Drift
Once you've detected and addressed drift, the next step is to assess the impact on your model's performance. This process helps confirm whether the steps you took to handle drift have actually improved outcomes.
Pre-Drift vs. Post-Drift Performance
Start by defining two key periods: a pre-drift reference period and a post-drift test period. To compare how your model performed during these times, use Welch's t-test to examine error distributions and verify any improvements.
The Population Stability Index (PSI) is a quick way to measure the extent of drift. A PSI under 0.1 suggests minimal drift, while a value above 0.25 signals serious issues that demand immediate attention. For models that rely on probabilities, keep an eye on metrics like the Brier Score and Log Loss. If these scores have risen significantly after drift, it’s a sign that prediction accuracy has taken a hit. Additionally, check the Expected Calibration Error (ECE) - this should remain below 0.015. A higher ECE indicates that your model may need recalibration.
Beyond technical metrics, monitor business-oriented indicators like ROI and CLV. Even if your technical metrics seem fine, a drop in CLV could mean your model is no longer outperforming market benchmarks. Together, these metrics help confirm whether your drift detection and management strategies are translating into better performance.
Benchmarking Against Real Datasets
Testing your drift-handling strategies on actual historical data provides valuable insights into how well they hold up under practical conditions. Natural events, like major shifts in market trends, can serve as useful drift boundaries for benchmarking.
To ensure reliable results, use datasets with at least 1,000 bets or predictions. Smaller datasets risk producing misleading conclusions due to random chance. When analyzing performance shifts, apply the KS test to prediction errors for a clear comparison. This approach helps validate whether your drift management strategies are genuinely effective or just appear so in smaller samples.
Continuous Improvement Processes
Managing drift isn’t a one-and-done task - it requires ongoing attention. During periods of high volatility, such as major rule changes in a league or unexpected global events, consider incorporating human oversight into your automated systems. Experts can spot contextual nuances that algorithms might overlook. Regularly track your PSI, and treat any reading of 0.25 or higher as a red flag. This calls for immediate investigation and potentially retraining your model. Consistent evaluation ensures that small problems don’t spiral into larger issues over time.
Using WagerProof for Long-Term Drift Management

To stay ahead of concept drift and maintain your edge, WagerProof provides tools designed to adapt to changing market conditions over time.
Using WagerProof for Real-Time Outlier Detection
The Edge Finder identifies market inefficiencies by comparing prediction market spreads with consensus models. When spreads don’t align, it generates z-scores and "spread-diff" flags, signaling potential drift. If your model begins to deviate significantly from the market consensus, it could indicate that the underlying patterns have shifted.
Another key tool, Public Money Splits, highlights the gap between ticket percentage and money percentage. For example, if sharp money moves in one direction while public bets lean heavily in the opposite direction, it’s a sign that market dynamics might be changing. Monitoring these discrepancies helps pinpoint when your model may be relying on outdated public sentiment instead of current trends.
These real-time insights are crucial for feeding into the model validation process.
WagerBot Chat for Model Validation
WagerBot Chat acts as a real-time validator for your model’s predictions. It pulls live data - such as weather updates, injury reports, odds changes, and your model’s predictions - to cross-check outputs and flag adjustments when drift is detected.
The AI Game Simulator works alongside this by running thousands of simulations based on current team dynamics. It provides win probability percentages that reflect today’s conditions rather than relying on historical averages. Comparing these simulations with your model’s predictions adds another layer of scrutiny.
Together, these tools ensure your model’s predictions are both accurate and resilient, forming a strong foundation for long-term betting strategies.
Building a Long-Term Betting Strategy
The Model Aggregator combines predictions from multiple sources into a consensus ranking. This method smooths out errors caused by individual models drifting due to outdated assumptions, especially during volatile periods when quick adaptation is critical. By relying on an aggregated view, you can maintain consistent performance even as market conditions fluctuate.
WagerProof offers several plans to suit different needs. The Free Plan provides basic access to the Edge Finder and statistics, while the Premium Plan includes advanced features like WagerBot Chat, the AI Game Simulator, historical analytics, and access to a private Discord community. For professional syndicates dealing with large-scale drift challenges, the Enterprise Plan offers custom integrations and advanced analytics tailored to specific requirements.
Conclusion: Staying Ahead of Concept Drift in Betting Models
Concept drift isn’t a problem you tackle once and forget about - it’s a constant challenge that demands ongoing attention and smart strategies. The connection between your input data and betting outcomes is always shifting. Teams improve, strategies evolve, and market dynamics never stay still. A model that worked last season won’t cut it without adjustments.
The best way to handle this involves a mix of statistical tools and practical retraining methods. For example, techniques like Page-Hinkley tests can catch gradual drift, while Kolmogorov-Smirnov tests are great for spotting distribution changes. Pair these with chronological backtesting and regular retraining to keep your model sharp. If retraining isn’t immediately possible, tweaking decision thresholds - like requiring higher win probabilities - can help maintain accuracy. Keep an eye on metrics like the Population Stability Index (PSI), which should stay under 0.1 for stable performance, and monitor Closing Line Value (CLV) for signs of trouble, such as consistent drops below 1-2%, which indicate your model is losing its edge.
Real-time data is another critical piece of the puzzle. Your model needs access to up-to-date information like injury reports, weather conditions, odds fluctuations, and public betting trends - not just historical data. Platforms like WagerProof make this easier by offering tools to spot anomalies, validate predictions using WagerBot Chat, and combine multiple model outputs to reduce errors caused by drift.
The betting world moves fast. Coaches get fired mid-season, star players are traded, and leagues change rules overnight. Your model must be adaptable to these shifts while staying grounded in performance data. Building these capabilities isn’t just about surviving - it’s about thriving in a constantly changing environment.
FAQs
How do I know drift is real and not variance?
To determine whether drift is genuine and not just random variance, look for statistically significant changes in data patterns or model performance. You can use techniques like sliding window comparisons, statistical tests, or change detection algorithms to analyze the data. If you notice consistent and meaningful deviations in metrics - such as error rates or data distributions - it likely indicates true concept drift rather than mere noise or random fluctuations.
How often should I retrain my betting model?
The timing for retraining your model hinges on identifying concept drift - a phenomenon where data patterns evolve over time. Keep a close eye on your model by tracking changes in data relationships or noticing dips in prediction accuracy. If you spot a marked drift, it's essential to retrain quickly to preserve your model's reliability. Consistent monitoring helps you pinpoint the ideal moments for retraining, ensuring your betting model stays sharp and effective.
What live data matters most for drift control?
Key metrics for monitoring drift in real-time focus on changes in data distribution and model performance, even when labels aren't available. Pay close attention to prediction confidence, probability calibration, and shifts in statistical properties like distributions or correlations. Tools such as WagerProof offer real-time insights to detect anomalies and data shifts, enabling you to adjust strategies effectively and keep your model performing accurately.
Related Blog Posts
Ready to bet smarter?
WagerProof uses real data and advanced analytics to help you make informed betting decisions. Get access to professional-grade predictions for NFL, College Football, and more.
Get Started Free