Expected ROI vs. Actual ROI in Betting
Expected ROI is what you predict your bets will earn based on probabilities and odds. Actual ROI is what you actually earn after placing those bets. Comparing these two metrics helps you figure out if your betting strategy is working or if luck is skewing your results.
Key takeaways:
- Expected ROI measures your theoretical edge before betting.
- Actual ROI shows your real-world performance.
- Variance (random short-term swings) often creates gaps between the two, especially with small sample sizes.
- Over 1,000+ bets, actual ROI usually aligns closer to expected ROI.
- Tools like Closing Line Value (CLV) and tracking historical data can help refine your strategy.
- Professional bettors aim for long-term ROIs between 4% and 10%, but only 3% of bettors stay profitable consistently.
To bridge the gap between expected and actual ROI, focus on disciplined bankroll management, improving your betting models, and tracking metrics like CLV. Patience and consistency are key, as short-term losses don’t always mean your strategy is flawed.
Expected vs Actual ROI in Sports Betting: Key Statistics and Convergence Data
Expected ROI vs. Actual ROI: Definitions
What is Expected ROI?
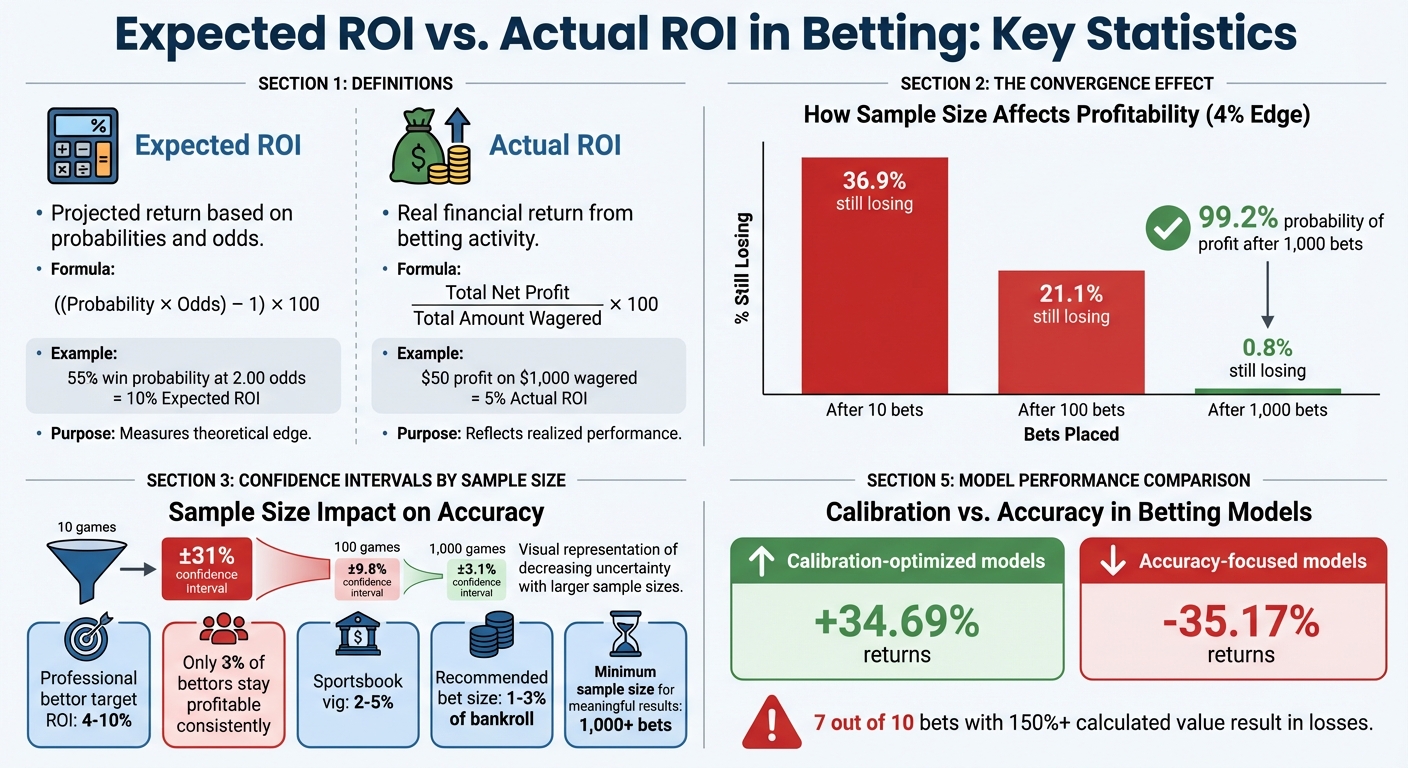
Expected ROI, often referred to as Expected Value (EV%), is the projected return on your bets based on estimated win probabilities and the odds offered. It essentially tells you the average amount you’d anticipate winning or losing per bet if you were to repeat the same wager an infinite number of times. This metric highlights your theoretical advantage, combining probability and odds into a single figure.
The formula for calculating Expected ROI using decimal odds is simple:
Expected ROI (%) = ((Probability × Odds) – 1) × 100
Let’s break it down with an example: If you estimate a 55% win probability on a bet with odds of 2.00, the calculation would look like this:
((0.55 × 2.00) – 1) × 100 = 10% Expected ROI
This means that, over the long term, you could expect to earn an average of $10 for every $100 wagered.
"Expected Value (EV) is the average amount you expect to win or lose per bet if you could repeat the same wager infinitely." – whatisvaluebetting.com
Expected ROI acts as a guide, helping you decide whether a bet is likely to be profitable before you commit to it.
What is Actual ROI?
Actual ROI, on the other hand, reflects the real financial return from your betting activity. It’s calculated by comparing your net profit to the total amount you’ve wagered. The formula is:
Actual ROI (%) = (Total Net Profit / Total Amount Wagered) × 100
For example, if you’ve wagered $1,000 in total and made a net profit of $50, your actual ROI would be:
(50 / 1,000) × 100 = 5% Actual ROI
Alternatively, you can calculate it using:
(Total Returned / Total Staked) × 100.
"ROI is a measure of the efficiency of an investment – or how much money you can expect to make relative to the amount of money you risk." – Patrick Cwiklinski, Evergreen Manager and Sportsbook Expert
While Actual ROI provides a clear picture of your historical performance, it doesn’t always reflect the quality of your decisions, especially over a small number of bets. It’s more of a snapshot of what has already happened, rather than a prediction of what’s to come.
Why Comparing Expected and Actual ROI Matters
Understanding both metrics is one thing, but comparing them is where the real insights come in. This comparison helps you evaluate whether your outcomes are driven by skill or just luck. Variance - a natural fluctuation in results - can mask your true edge. By tracking both Expected and Actual ROI, you can identify whether differences arise from random chance or flaws in your probability estimates by using real-time sports data platforms.
For instance, if your Actual ROI consistently falls short of your Expected ROI, it could signal that your model is overestimating probabilities or missing key factors. Over a large sample size - say, 1,000+ bets - a true 4% edge has a 99.2% probability of yielding a profit. This long-term convergence helps separate temporary luck from genuine skill.
| Metric | Definition | Purpose |
|---|---|---|
| Expected ROI | Projected return based on model probabilities and odds | Measures theoretical edge and decision quality |
| Actual ROI | (Net Profit / Total Wagered) × 100 | Reflects realized financial performance |
| Variance | Deviation of actual results from the expected mean | Explains short-term discrepancies between metrics |
The upcoming sections will dive deeper into the causes of these discrepancies and offer strategies to fine-tune your approach, ensuring your expectations align more closely with reality.
Understanding Variance in Sports Betting | Sports Betting 101
Common Causes of Discrepancies Between Expected and Actual ROI
Even when your probability estimates and value bets seem spot on, the actual returns might not match up. Pinpointing the reasons behind this gap is crucial for fixing common betting mistakes and fine-tuning your approach and aligning expectations with reality.
Variance and Sample Size
Short-term randomness is often the biggest reason for discrepancies in ROI. Even with a genuine edge, losing streaks can happen purely due to variance. For example, a Monte Carlo simulation of bettors with a 4% edge showed that 36.9% were still at a loss after 10 bets, 21.1% after 100 bets, and only 0.8% after 1,000 bets.
The size of your sample also plays a massive role. Smaller samples lead to wider confidence intervals. For instance, tracking just 10 games gives a 95% confidence interval of ±31%. But as the sample grows to 100 games, it narrows to ±9.8%, and at 1,000 games, it’s down to ±3.1%. Without enough data, it’s hard to see your true edge clearly.
"The unpredictable nature of small samples means variance dominates, and 'running bad' isn't proof you lack skill." – DRatings
Variance becomes even more pronounced at higher odds. A bettor wagering at odds of 10.00 would need about 22,000 bets to reach the same statistical confidence as someone betting at odds of 2.00 with just 2,500 bets. This highlights the importance of fine-tuning your models to account for these fluctuations.
Model Limitations and Assumptions
The reliability of your expected ROI depends entirely on the quality of your probability estimates. If your model prioritizes accuracy over calibration, it can misrepresent your edge. In one study, calibration-optimized models saw returns of +34.69%, while accuracy-focused models ended up at -35.17%.
Misjudging probabilities at extreme values is particularly risky. Research shows that 7 out of 10 bets with a calculated value exceeding 150% actually result in losses. This is often due to errors in probability estimates rather than market inefficiencies. Small miscalculations can have a big impact - an error on a -150 favorite might cost pennies, but on a +400 underdog, it could turn a supposed +EV bet into a significant loss.
"If your number disagrees with the market, there's a greater chance than not that your number is wrong, not the market." – Colin Davy, Betscope
Models also need to consider natural reversion to long-term averages. Bettors often overemphasize recent "hot streaks" when building models, overlooking the fact that extreme performances tend to balance out over time. Beyond these modeling challenges, real-world unpredictability adds another layer of complexity.
External Factors Impacting Outcomes
Unexpected events - like last-minute injuries, sudden weather changes, or lineup adjustments - can shift probabilities after your bet is placed. While your expected ROI is based on specific conditions, the actual game might play out under entirely different circumstances.
Take the NFL as an example: sportsbook point spreads explain about 86% of the variability in median outcomes, and point totals cover around 79%. That leaves 14% to 21% of randomness - overtime, extra innings, one-point games, and other unpredictable factors that can flip a high-EV bet into a loss.
On top of all that, the sportsbook’s vig (typically 2% to 5%) adds another hurdle. If your model’s edge is smaller than both the margin of error in your probabilities and the vig, your expected ROI might be overly optimistic from the start. It’s no wonder that only 2% to 3% of sports bettors manage to stay profitable each year, according to data from 2024.
Strategies for Aligning Expected and Actual ROI
Bridging the gap between what you expect to earn and what you actually earn in sports betting takes careful data analysis, disciplined bankroll management, and quick market adjustments.
Tracking Historical Data and Spotting Trends
Every bet you make should be documented with all the details - odds, stake, results, expected value, and the market’s closing odds. This level of tracking helps you determine if your betting edge is real or just a fluke.
One key metric to monitor is Closing Line Value (CLV), which compares the odds you bet at to the final market odds before the game starts. If you consistently beat the closing line, it’s a strong sign that your model has predictive power - even if your short-term profits don’t reflect it. For instance, in June 2025, a soccer betting model appeared to break even over 600 bets, despite showing an expected edge. A deeper look revealed it was missing CLV by 0.10 odds points due to not accounting for last-minute lineup changes. By adjusting for injuries and weather, the actual ROI jumped from 0% to 4.2% over the next 1,200 bets.
Another useful tool is Expected ROI (xROI), which adjusts for luck by re-grading bets based on game stats rather than just the final result. In February 2024, Rufus Peabody reviewed a bet where, although the game went to overtime, the regulation score suggested an 88% chance of staying under the total. This translated to an xROI of 68%.
"CLV is useful because it stabilizes much more quickly than actual results... How can we use results in a manner similar to CLV to be more predictive, more quickly? Basically, how can we de-luck our actual performance?" – Rufus Peabody, Professional Bettor, Unabated
It’s also crucial to keep your model calibrated. Metrics like the Brier Score (which measures the accuracy of predicted probabilities) can show whether your predictions align with reality. Regularly checking reliability curves for drift and recalibrating monthly if your Expected Calibration Error (ECE) exceeds a set threshold (e.g., 0.015) ensures your model stays on point. A well-calibrated betting model typically targets a long-term ROI of 3% to 7%, but meaningful results often require a sample size of at least 1,000 bets.
Using WagerProof for On-the-Fly Adjustments

While historical data helps you understand your edge over time, real-time tools can refine your strategy as markets shift.
WagerProof’s Edge Finder is a real-time tool that highlights value bets by analyzing prediction market spreads, historical data, and statistical models. This feature helps you spot when your expected ROI might be off due to sudden market changes, such as late injury updates or weather conditions.
Another feature, WagerBot Chat, connects you with live professional data. You can ask specific questions about ongoing games and get responses based on real-time stats.
By tracking CLV through the Edge Finder, you can ensure your bets consistently outperform the closing line - a much more reliable predictor of long-term success than short-term results. The platform also flags mismatches in prediction market spreads, signaling opportunities to fade certain games and uncover hidden value. This kind of transparency allows you to refine your ROI calculations using a broader market perspective, rather than relying solely on your model.
Once you have these insights, the next step is to manage your risk effectively through disciplined bankroll practices.
Practicing Smart Bankroll Management
No matter how good your data or adjustments are, poor risk management can derail your betting strategy. A consistent staking approach - typically betting 1% to 3% of your bankroll per wager - helps you manage the inevitable ups and downs of sports betting.
This level of discipline is especially important because even with a 4% edge, about 21.1% of bettors could still be in the red after 100 bets due to short-term variance. Flat betting, where you wager the same percentage of your bankroll each time, protects your funds during losing streaks and gives your edge enough time to show its value.
Using sensitivity analysis with confidence intervals (e.g., ±5%) can help you adjust bet sizes based on your level of certainty. For example, you might bet smaller amounts when uncertainty is high and larger amounts when you’re more confident. The ultimate goal is to place enough bets - usually over 1,000 - for your actual ROI to align with your expected ROI.
Case Studies: Expected vs. Actual ROI Scenarios
These examples highlight how expected ROI (xROI) and actual ROI can differ in the short term but often align over time with consistent analysis and disciplined execution.
Example 1: High Expected ROI with Negative Actual ROI
On February 3, 2024, professional bettor Rufus Peabody placed a wager on the Northwestern vs. Minnesota game, betting on Under 139 total points. By the end of regulation, the score was tied at 61-61 (122 total points). Based on historical data, the probability of the under hitting stood at an impressive 88%, pointing to a strong value bet. However, the game went into overtime, and the final score climbed to 141 points. The result? Peabody experienced an actual ROI of -100%, despite his calculated expected ROI (xROI) of +68% based on the regulation score. This situation underscores how unpredictable factors - like overtime - can turn a statistically sound wager into a loss.
"Expected ROI is the most simple version using just the game's final score in order to be a better predictor of future ROI than actual ROI." – Rufus Peabody, Professional Bettor
The lesson here is clear: tracking xROI helps distinguish between losses caused by variance and those resulting from flawed betting strategies.
| Metric | Value |
|---|---|
| Bet Type | Under 139 total points |
| Regulation Score | 61-61 (122 points) |
| Final Score (with OT) | 141 points |
| Actual ROI | -100% |
| Expected ROI (xROI) | +68% |
| Probability Under Hits (Regulation) | 88% |
Example 2: Long-Term Convergence of Expected and Actual ROI
A 2025 simulation study by Dratings used 1,000 Monte Carlo trials to explore how a 4% edge performs across varying sample sizes. The results were revealing: after 100 bets, 21.1% of participants were still losing money, even with a real mathematical edge. However, as the sample size grew to 1,000 bets, 99.2% of participants ended in profit, with 81.1% achieving gains of 50 or more units (a standardized measure of profit). Notably, the likelihood of being in the red dropped from 36.9% after 10 bets to just 0.8% after 1,000 bets.
This study highlights the importance of patience and consistency. A genuine edge becomes more apparent over time, provided bettors stick to disciplined practices and rely on well-calibrated models.
| Number of Bets | Probability of Profit | Probability Still in the Red |
|---|---|---|
| 10 Bets | 63.1% | 36.9% |
| 100 Bets | 78.9% | 21.1% |
| 1,000 Bets | 99.2% | 0.8% |
These examples emphasize that consistent monitoring, data analysis, and disciplined bankroll management are essential for aligning actual returns with expected outcomes over the long haul.
Conclusion
Grasping the gap between expected and actual ROI is what separates skillful betting from relying on pure luck. This difference often boils down to factors like variance, sample size, and the quality of your data. If your actual returns don't match your expectations, it doesn’t automatically mean your strategy is flawed - variance can easily mask an edge when dealing with smaller sample sizes. That’s why taking a disciplined, long-term approach is essential to distinguish genuine skill from short-term fluctuations.
To stay on track, it's crucial to consistently monitor both expected and actual outcomes. Compare these metrics over a large sample - at least 1,000 bets - before making significant adjustments to your strategy. This approach helps identify whether you're simply in a rough patch or if your model has deeper issues that need fixing. Tools like CLV (Closing Line Value) can also provide a quicker way to assess performance and stay grounded.
Equally important is maintaining disciplined bankroll management. Keep individual bets within 1–3% of your total bankroll and resist the urge to chase losses or increase wager sizes impulsively. Professional bettors aiming for a long-term ROI of 4–10% know that steady, modest gains build up over time. However, this only works if you’re prepared to ride out the inevitable downswings.
FAQs
How can I make my Expected ROI predictions more accurate?
To boost the accuracy of your Expected ROI predictions, focus on fine-tuning your probability estimates and ensuring your models align closely with real-world outcomes. Tools like calibration curves and reliability diagrams are great for checking how well your predicted probabilities match actual results. This reduces discrepancies and ensures your ROI calculations are grounded in realistic assumptions.
Leverage data-driven techniques, such as market-based probabilities or advanced statistical models, to sharpen your predictions further. Regularly backtesting your strategies and analyzing performance with metrics like the Brier Score can uncover hidden biases in your approach. By consistently calibrating and testing, you'll be better equipped to make informed, data-supported betting decisions.
How does variance affect the gap between expected ROI and actual ROI in sports betting?
Variance plays a major role in why actual ROI often doesn't align with expected ROI in sports betting. While expected ROI is a calculated estimate based on long-term averages and a consistent approach, actual ROI can swing unpredictably due to the inherent randomness of outcomes - especially when dealing with a smaller number of bets.
Even highly skilled bettors with a positive expected value (EV) aren't immune to streaks of wins or losses caused by variance. The good news is that over time, as the number of bets increases, these ups and downs tend to balance out, bringing actual ROI closer to the expected ROI. To handle variance effectively, it’s crucial to practice solid bankroll management and keep a long-term outlook. Short-term fluctuations are simply part of the game.
What is Closing Line Value (CLV) and how can it improve my betting strategy?
Closing Line Value (CLV) is a way to measure how the odds you bet on stack up against the final odds (the closing line) right before an event begins. If you regularly lock in better odds than the closing line, it’s a clear sign that your bets are based on solid predictive reasoning, rather than just short-term luck.
Paying attention to CLV shifts your focus away from random outcomes, like close wins or losses, and helps you assess the overall quality of your bets. Over time, this perspective allows you to fine-tune your strategy, aiming to place bets where you’ve identified an advantage. Consistently beating the closing line improves your odds of achieving long-term profitability.
Related Blog Posts
Ready to bet smarter?
WagerProof uses real data and advanced analytics to help you make informed betting decisions. Get access to professional-grade predictions for NFL, College Football, and more.
Get Started Free