
Finding Value Bets with Correlation Analysis
Sports betting is not just about luck - it’s about math. To make smarter bets, you need to focus on expected value (EV), which measures whether a bet is worth the risk based on its probability versus the odds offered. This article explains how correlation analysis - understanding how events are statistically linked - can help you identify mispriced bets and improve your chances of winning.
Key takeaways:
- A value bet occurs when the actual chance of an event is higher than what the odds imply.
- Correlation analysis reveals relationships between events (e.g., a quarterback's passing yards and team points) that sportsbooks might misprice.
- Sportsbooks often adjust odds for positive correlations (events likely to happen together) but may overlook negative correlations (events that seem unlikely to pair but can).
- Tools like WagerProof simplify finding these opportunities by analyzing data and probabilities.
Avoid overpaying for correlated bets - like same-game parlays with obvious links - and look for hidden value in less popular combinations. This approach, backed by data, can give you an edge over sportsbooks.
What Everyone gets WRONG About Correlated Parlays
Understanding Correlation in Sports Data
Correlation measures how one outcome influences another. In sports betting, this involves determining whether two events move together, move in opposite directions, or have no connection at all. The most widely used metric for this is the Pearson correlation coefficient, which ranges from –1 to +1. A value of +1 reflects a perfect positive correlation, 0 indicates no relationship, and –1 signifies a perfect negative correlation. In sports betting, correlations typically fall between –0.4 and +0.6.
Sportsbooks rely on models like Gaussian copulas to estimate joint probabilities while maintaining the individual odds of each bet. They also calculate correlation factors by comparing the actual frequency of combined outcomes to what would be expected if the events were independent. These studies consistently show that correlation factors increase joint win probabilities. This foundational knowledge is crucial for understanding how sportsbooks use advanced models to quantify these connections.
"The fundamental mathematical challenge: outcomes within the same game are not independent."
– Joey Shackelford, Wizard of Odds
With this groundwork in place, let’s examine how different types of correlation impact betting outcomes.
3 Types of Correlation and Their Effects
Positive correlation happens when outcomes are likely to occur together. For example, if a quarterback throws for a high number of yards, his team is more likely to score a lot of points, and his wide receiver is more likely to have a standout performance [12, 14]. Since the combined probability of these events is higher than it would be if they were independent, sportsbooks adjust payouts downward. This explains why Same Game Parlay (SGP) odds often seem smaller compared to traditional parlays.
Negative correlation occurs when one outcome reduces the likelihood of another. For instance, if a team is winning by a large margin, its star running back might rest during the fourth quarter, potentially falling short of his rushing yard prop. In such cases, the joint probability is lower than the product of the individual probabilities. These combinations can sometimes offer value, as casual bettors may overlook the mispricing, and sportsbooks might not fully adjust the odds [10, 14].
Zero correlation refers to statistically independent outcomes. For example, an NBA player’s scoring in one game and the result of an unrelated NFL contest are independent events [13, 15]. In these cases, the standard parlay calculation applies: multiply the individual probabilities (P(A) × P(B)) to determine the joint probability.
In sports like the NFL, quarterback passing yards and wide receiver receiving yards often show strong positive correlation, while running back rushing yards and wide receiver receiving yards may exhibit weak negative correlation. This is largely because there’s only one football, and their roles can conflict. Similarly, team total points usually correlate positively with offensive player props, though the strength of this relationship varies depending on the position.
Grasping these correlations can help bettors identify value plays and understand why parlay odds sometimes deviate from simple probability calculations.
How Correlation Affects Parlay Probabilities
When events are independent, you calculate a parlay’s probability by multiplying the probabilities of each leg. For example, a three-leg parlay with -110 odds for each leg (approximately 52.4% per leg) results in a combined win probability of about 14.4% [10, 14]. But when outcomes are correlated, this straightforward multiplication doesn’t apply. Instead, you must consider conditional probability: P(A) × P(B|A) [10, 15].
Positive correlation increases the overall win probability. For instance, if three positively correlated -110 legs have a 20% joint win probability instead of the 14.4% expected from independent events, the fair payout adjusts to about +400, rather than the +600 implied by independent calculations [10, 14]. This difference, often called the "correlation tax," is how sportsbooks protect their margins.
A practical example is seen in MLB with the "bottom of the 9th" factor. If the home team is leading, the final half-inning may not be played, reducing scoring opportunities. This creates a natural correlation between bets on a Home Win and an Under for the game total. For home underdogs at +150 or higher, the correlation factor can rise to 1.1259 - a 12.59% increase in win probability.
Using Correlation Analysis to Find Value Bets
5-Step Correlation Analysis Process for Finding Value Bets in Sports Betting
Correlation analysis is a powerful way to turn theoretical expected value (EV) into actionable betting strategies. By identifying and leveraging relationships between outcomes, you can uncover opportunities that sportsbooks may have mispriced.
Step-by-Step Correlation Analysis Process
-
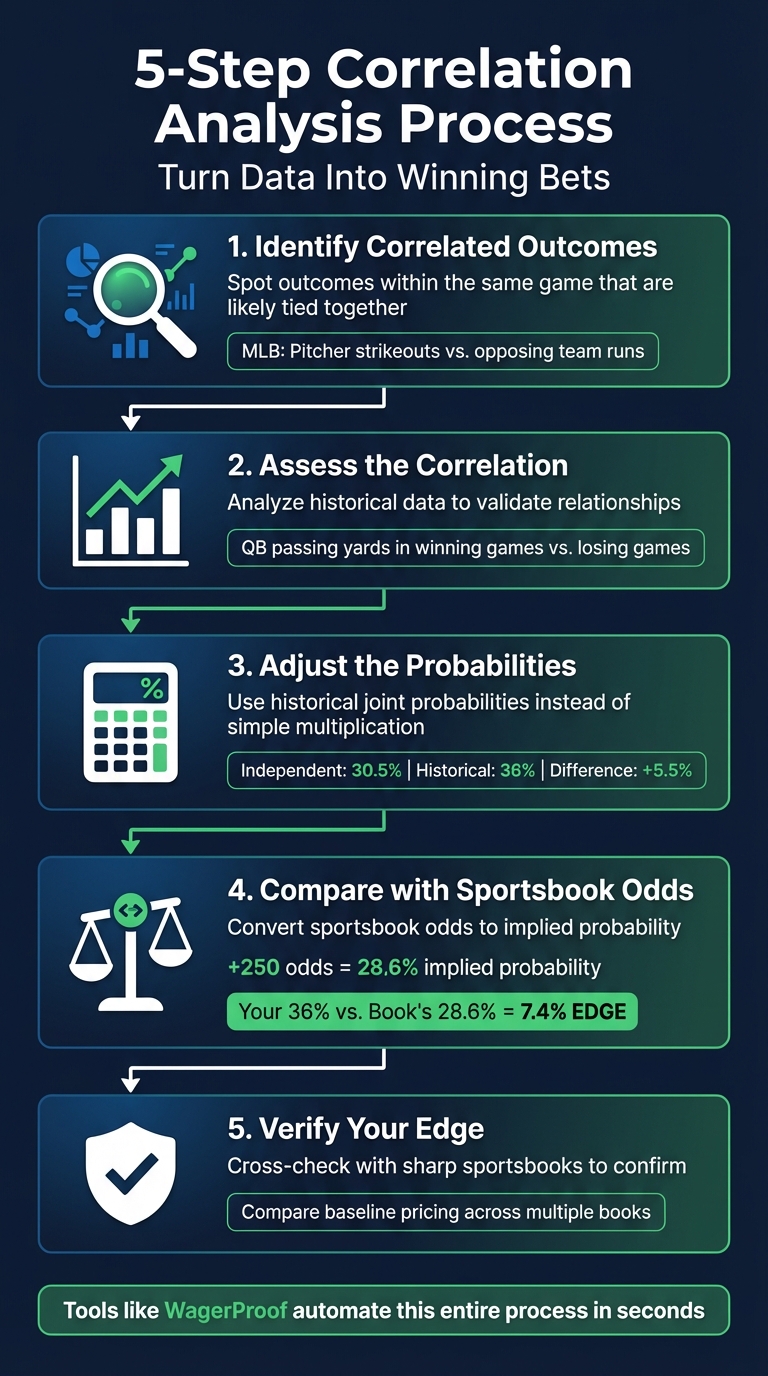
Identify Correlated Outcomes:
Start by spotting outcomes within the same game that are likely tied together. For example, in MLB, a pitcher’s strikeout count might connect to the opposing team’s run total. -
Assess the Correlation:
Look at historical data to validate these relationships. For instance, if a quarterback consistently posts higher passing yards in games his team wins, this suggests a positive correlation between his stats and team success. -
Adjust the Probabilities:
Instead of using simple probabilities, rely on historical joint probabilities. For example, if a quarterback has a 52.4% chance to exceed a passing yard threshold and his team has a 58.3% chance to win, the independent product would be 30.5%. But if historical data shows this combo happens 36% of the time, that’s your true joint probability. -
Compare with Sportsbook Odds:
Convert the sportsbook's odds into implied probabilities. For example, +250 odds translate to an implied probability of 28.6% (calculated as 100 ÷ 350 ≈ 28.6%). If your adjusted probability (like 36%) is higher, you’ve identified a value bet - here, with a 7.4% edge . -
Verify Your Edge:
Cross-check your findings by comparing the baseline pricing with odds from sharp sportsbooks. This step ensures that your edge isn’t based on flawed assumptions .
Once you’ve mastered this process, you can apply it to real markets to find value bets based on these correlations.
Common Correlation Patterns in Betting Markets
-
Positive Correlations in the NFL:
A classic example is the link between quarterback passing yards and a wide receiver’s receiving yards. When a quarterback exceeds his passing total, his top receiver often follows. Sportsbooks are aware of this and typically price same-game parlays with a higher house edge - ranging from 15% to 25%, compared to just 4% to 5% on standalone bets . -
MLB's "Ninth Inning Factor":
The structure of MLB games creates natural correlations. For example, late-game scenarios can influence both team and individual performance, offering opportunities for sharp bettors. -
Negative Correlations in Blowout Scenarios:
Blowouts often lead to unexpected patterns, like lower total scores due to effective clock management by the leading team. These less obvious, negatively correlated outcomes are sometimes mispriced, offering value to those who spot them .
"The bets that 'feel' smartest (high correlation, all legs supporting each other) are exactly the ones where the book has the most pricing information and the largest edge."
– Joey Shackelford, Wizard of Odds
While this process can seem daunting, automated tools can help streamline the analysis.
Using WagerProof for Correlation Analysis

Manually analyzing correlations requires significant time, data, and modeling expertise. That’s where WagerProof steps in to simplify the process:
-
Edge Finder:
This tool processes data through multiple predictive models to calculate a fair price. It then compares this fair price to current sportsbook odds, helping you identify mispriced correlations quickly. -
AI Game Simulator:
By running thousands of simulations per game, the AI Game Simulator predicts joint outcomes while factoring in real-time variables like injuries or weather. For instance, if a star running back is ruled out just before kickoff, the simulator adjusts its forecasts immediately. -
WagerBot Chat:
WagerBot Chat allows you to explore specific correlation scenarios interactively. Ask questions like, "What’s the historical correlation between home underdogs and the Under in MLB?" and get instant, data-driven insights from live professional data.
These tools eliminate much of the guesswork, making it easier to spot and act on value bets.
Using Positive and Negative Correlations for Edge
When it comes to refining your betting strategy, understanding positive and negative correlations can give you an advantage. By strategically leveraging these correlations, you can separate genuine value bets from those that appear tempting but are ultimately overpriced. Sportsbooks approach pricing for positive and negative correlations very differently, and identifying where they’re vulnerable can be a game-changer for long-term profitability.
Avoiding Overpriced Positive Correlations
Some bets might seem like no-brainers, but they often come with inflated prices. Take, for instance, a bet combining a quarterback’s passing yards over with his team’s total points over. It feels logical - if the quarterback is racking up yards, the team is probably scoring. But sportsbooks know this pattern all too well and use sophisticated pricing models to capitalize on it. While the house edge on a typical single bet hovers around 4–5%, that edge jumps to 15–25% for Same-Game Parlays (SGPs) featuring positive correlations like this one.
Sportsbooks use advanced statistical models to adjust payouts on bets with strong correlations. Even if the correlation increases your true win probability by 30–50% compared to independent events, the odds offered rarely reflect that full value. For example, building SGPs around "narrative stacks" - like betting on a favorite to win, the quarterback to hit his over, and the game total to go over - plays directly into the sportsbook's pricing advantage.
Finding Value in Negative Correlations
Negative correlations, on the other hand, can provide opportunities where value is often overlooked. For example, betting on a team to win while also wagering that the opposing running back will go over his rushing total might seem counterintuitive. However, these outcomes aren’t mutually exclusive, and because casual bettors tend to avoid such combinations, sportsbooks may offer more favorable odds.
This trend is especially evident in MLB. When the home team is an underdog with odds of +150 or higher, a Home Win + Under parlay delivers a correlation factor of 1.1259 - essentially a 12.59% value boost. Why? Home underdogs that win often do so in low-scoring, tightly contested games that end in 8.5 innings. The market undervalues this combination because it doesn’t align with the typical "favorite dominates" narrative that drives public betting.
You can apply the same logic across other sports. In the NFL, pairing a defensive team’s moneyline with the opposing quarterback’s passing yards over might seem odd, but it makes sense in certain scenarios. If the defense forces the other team into a pass-heavy comeback situation, both bets can hit. These contrarian combinations attract less public interest, leaving sportsbooks with less pricing data and often resulting in better odds for sharp bettors.
Conclusion
Our analysis of correlations highlights a clear path to refining your strategy for value betting. By leveraging correlation analysis, you can replace guesswork with data-driven decisions. Understanding how outcomes connect - whether through positive or negative relationships - creates opportunities to spot bets that sportsbooks might misprice. In fact, AI-powered predictions using correlation analysis have been shown to improve bet success rates by 15–20%.
Steer clear of the "correlation tax" on obvious positive correlations, and focus on uncovering value in negative correlations often overlooked by casual bettors. For example, specific parlay combinations can reveal hidden value through underappreciated negative correlations. This isn’t just theory - it's supported by data from 27,625 MLB games played between 2010 and 2021.
"Data-driven betting takes the guesswork out of wagering by turning it into a science." – WagerProof
Tools like WagerProof's Edge Finder and AI Game Simulator analyze thousands of variables in seconds, exposing mispriced bets with precision. Their multi-model consensus approach provides clear, data-supported insights, helping you understand why a particular bet has an edge. With these insights, you can make smarter, more calculated wagers.
The ultimate goal is to identify mathematical edges and manage your bankroll effectively for long-term success. By combining these tools with a disciplined approach to correlation analysis, you can overcome the challenges of the correlation tax and position yourself for consistent profitability. With data on your side, the odds can finally shift in your favor.
FAQs
How does correlation analysis help uncover value bets in sports betting?
Correlation analysis is a powerful way to identify value bets by uncovering relationships between betting lines and actual game performance data. By understanding how specific outcomes are linked, you can pinpoint markets where the odds don’t fully align with the true probabilities. This creates opportunities to place bets that offer a positive expected value.
Take this example: If a quarterback’s passing yards are closely tied to a team’s total points scored, odds for bets related to these events might occasionally be mispriced. Spotting these connections gives you an edge, enabling smarter, data-driven bets.
To make this process even simpler, tools like WagerProof can do the heavy lifting for you. They highlight these correlations and surface potential value bets in real time, helping you make informed decisions with less guesswork.
What do positive and negative correlations mean in betting?
In betting, positive correlations happen when one outcome makes another more likely. For example, if a star player has an outstanding game, it could increase their team’s chances of scoring more points. In this case, both outcomes - an exceptional performance and a high team score - are connected and likely to occur together.
On the flip side, negative correlations occur when one outcome decreases the likelihood of another. For instance, placing a bet on a team to win while also betting on the opposing team to score a lot creates a conflict. If one happens, the other becomes less likely.
Recognizing these relationships can help you make more informed bets and spot opportunities where the odds might work in your favor.
How does WagerProof help you find value bets quickly and easily?
WagerProof takes the guesswork out of finding value bets by leveraging real-time sports data and cutting-edge tools. It digs into prediction markets, historical stats, and statistical models to pinpoint outliers and highlight potential opportunities for you.
The platform sends alerts whenever betting lines stray from actual probabilities, along with signals that help you spot odds that might be mispriced. With WagerProof, all the information you need to identify value bets is laid out clearly, making it easier to make informed decisions with confidence.
Related Blog Posts
Ready to bet smarter?
WagerProof uses real data and advanced analytics to help you make informed betting decisions. Get access to professional-grade predictions for NFL, College Football, and more.
Get Started Free