Historical Line Movement Trends Explained
Betting odds and point spreads shift constantly from the moment they’re released until the game starts. This is called line movement, and it reflects how sportsbooks and bettors react to new information, like injuries, weather, or betting trends. Understanding these shifts can help you identify patterns, spot professional betting activity, and find better odds.
Key Takeaways:
- Why lines move: Sportsbooks adjust odds to balance bets, respond to sharp money (professional bettors), and account for breaking news.
- Types of movements:
- Reverse Line Movement (RLM): When odds move against public betting trends, often signaling sharp money.
- Steam Moves: Sudden, market-wide shifts caused by large, coordinated bets.
- Early vs. Late Shifts: Early changes often reflect sharp action; late ones include public bets and last-minute updates.
- How to use this data: Look at historical trends, compare opening and closing lines, and analyze betting splits (public percentage vs. money percentage).
By studying historical line movement, you can better predict market reactions and improve your betting strategy.
How to Read Line Movement & Public Betting Percentage
What Drives Line Movement
Three key factors - public betting volume, sharp money, and breaking news - influence line movement. Each plays a unique role in shaping the odds, creating patterns that can often be spotted in historical data.
Public Betting and Market Sentiment
When a large number of casual bettors place their money on one side of a game, sportsbooks tweak the line to balance their financial exposure. This adjustment helps them manage risk effectively. As Sloan Piva, Content Producer at The Sporting News, puts it:
"Public betting can be an even greater influence to odds than a team or player's recent form. Odds allow sportsbooks to balance the action and manage their financial risk".
The public tends to favor favorites, high-profile teams like the Cowboys or Lakers, and "Over" bets on totals. This creates predictable patterns. For instance, when 70% to 80% of the betting volume leans heavily toward one side - a frequent occurrence - sportsbooks adjust the line to make the opposing side more appealing. A classic example is Super Bowl XLIV: 65% of public bets backed the Colts, pushing the line from -3.5 to -5.5. Recognizing these trends in historical data can provide valuable insights.
Sharp Money and Professional Betting
Professional bettors, or sharps, approach betting with a focus on statistical advantages, often placing large wagers as soon as lines are released when they perceive the numbers to be "soft". Unlike the public, sharp money can cause significant line movement even with fewer bets. For example, during a Packers game, the line shifted dramatically despite heavy public support, reflecting the influence of sharp action.
A phenomenon known as reverse line movement (RLM) is a strong indicator of sharp money. This occurs when the line moves in the opposite direction of where most bets are placed, signaling that sportsbooks are adjusting based on professional money rather than public volume. By analyzing betting splits - comparing the percentage of tickets to the percentage of total money using real-time sports data platforms - you can spot these patterns. For instance, if a team attracts only 20% of bets but accounts for 60% of the money, it's likely that sharps are backing that side.
But sharp money isn’t the only external force driving line changes.
News, Injuries, and External Events
Breaking news often causes immediate line adjustments. When a star player - like a starting quarterback or pitcher - gets ruled out, sportsbooks act swiftly, moving the line before most casual bettors even hear the news.
Weather conditions also play a role, especially in totals betting. Heavy rain or strong winds can lower the over/under because such conditions tend to hinder offenses and favor defensive play. Interestingly, the public often overreacts to such news, pushing the line further than the actual statistical impact justifies. Sharp bettors look for these overcorrections and seize the opportunity to bet at favorable odds.
Take MLB’s 2023 Opening Day matchup between the White Sox and Astros as an example. The White Sox opened as +145 underdogs, and despite 60% of the action favoring Houston, the line shifted to +130 for Chicago. This movement signaled professional interest in the underdog, even though public sentiment leaned the other way. The White Sox ultimately won 3-1.
Understanding these drivers - public sentiment, sharp money, and external events - can help uncover market inefficiencies and historical trends that others might miss.
Common Line Movement Patterns
Types of Betting Line Movement Patterns and Their Indicators
Three main patterns often emerge in betting markets: Reverse Line Movement (RLM), steam moves, and early versus late shifts.
Reverse Line Movement (RLM)
RLM occurs when betting lines move in the opposite direction of public betting trends, often signaling sharp money at play. For example, if 70% of bettors back the Cowboys at –6, but the line shifts to –5, that's a clear case of RLM. Danny Donahue from Action Network explains:
"Reverse line movement is typically an indication that a bettor or group of bettors with the money and respect to move a line is on that side".
This pattern suggests that sharp bettors are influencing the market more than public wagering volume. To spot RLM in historical data, compare the opening and closing lines alongside public betting percentages. For instance, if 80% of tickets are on one team, but the line moves toward the less popular side, sharp action is likely driving the shift. Historical NFL matchups often showcase such scenarios. However, external factors like injuries or weather can occasionally explain similar movements.
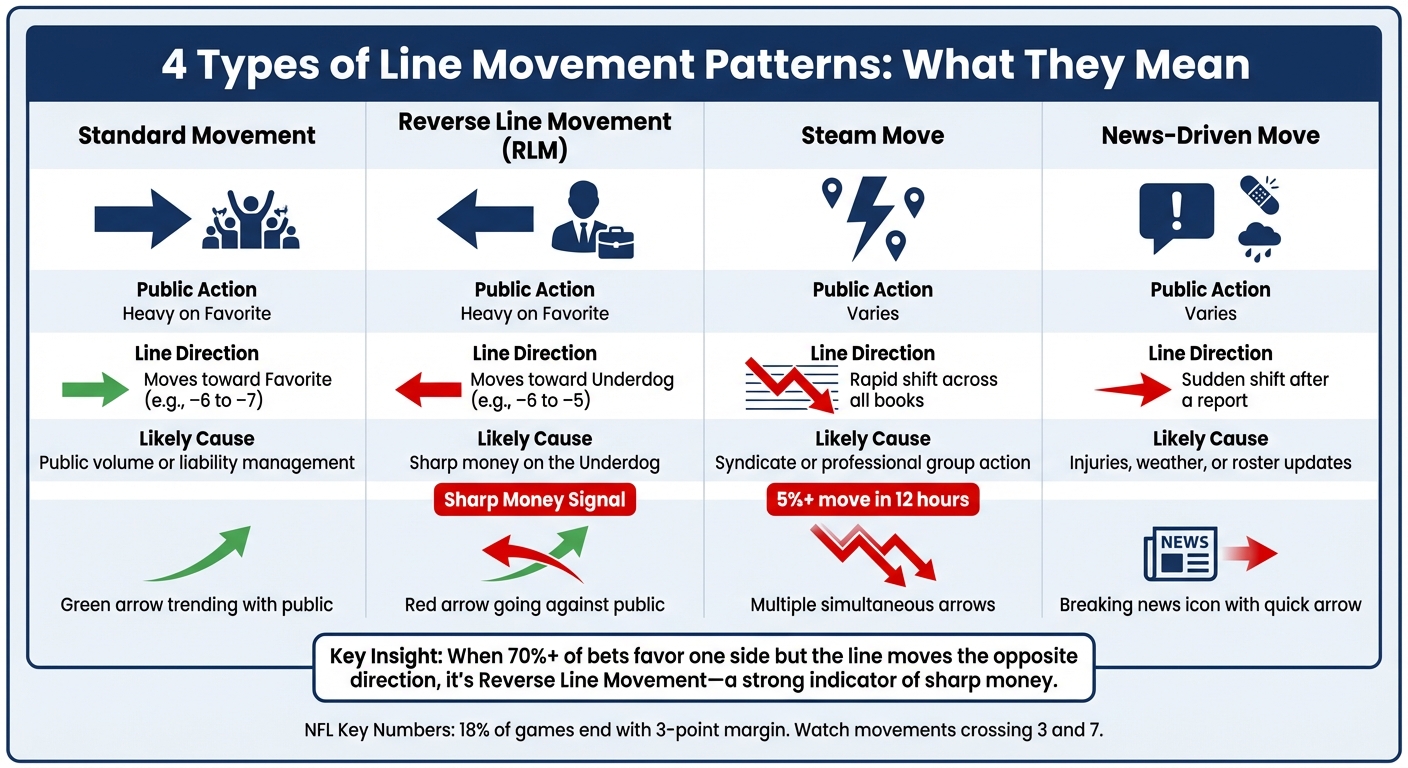
| Movement Type | Public Action | Line Direction | Likely Cause |
|---|---|---|---|
| Standard Movement | Heavy on Favorite | Moves toward Favorite (e.g., –6 to –7) | Public volume or liability management |
| Reverse Line Movement | Heavy on Favorite | Moves toward Underdog (e.g., –6 to –5) | Sharp money on the Underdog |
| Steam Move | Varies | Rapid shift across all books | Syndicate or professional group action |
| News-Driven Move | Varies | Sudden shift after a report | Injuries, weather, or roster updates |
While RLM highlights sharp betting behavior, steam moves represent rapid, coordinated actions across the market.
Steam Moves
Steam moves are sudden, simultaneous line changes across major sportsbooks, typically caused by professional syndicates or large betting groups placing significant wagers at multiple locations . These shifts often exceed 5% within 12 hours, signaling coordinated action. In the NFL, where 18% of games end with a 3-point margin, steam moves that cross key numbers like 3 or 7 can have substantial implications.
It's usually unwise to bet immediately after a steam move, as the value has likely been extracted. Additionally, some professional bettors employ "fake steam" to manipulate lines, intentionally moving them in one direction so they can later bet the opposite side at a better price .
Beyond these dramatic shifts, the timing of line movements offers further insights into market behavior.
Early vs. Late Line Movement
The timing of line changes provides clues about the types of bettors influencing the market and their strategies. Early line movement, which occurs shortly after lines open, is often driven by sharp bettors targeting mispriced odds before sportsbooks adjust . At this stage, sportsbooks limit wagers as they gather data and refine their numbers .
Late movement, on the other hand, reflects a mix of heavy public betting and last-minute sharp action. It also accounts for the latest news, such as injury updates or weather conditions . By the time lines close, they are considered highly accurate representations of the game's probability .
For example, in Super Bowl XLIV, the Colts opened as 3.5-point favorites. Public action - 65% of bets - pushed the line to –5.5 by kickoff. Early bettors who locked in odds at –3.5 gained a significant advantage over those betting later at worse odds like +5.5. Securing better odds than the closing line (known as Closing Line Value or CLV) is a key factor in achieving long-term betting success .
How to Use Historical Line Movement Data
Where to Find Historical Line Data
To develop a winning betting strategy, you need access to reliable historical data. Platforms like WagerProof offer real-time sports data combined with historical analytics, all through an easy-to-navigate interface. Their tools can automatically pinpoint outliers and highlight value bets by integrating factors like public betting percentages, money lean data, and statistical models. When selecting a data source, prioritize platforms that offer a mix of deep historical archives and real-time alerts. This combination helps you spot trends and take advantage of opportunities as they emerge. Once you’ve secured trustworthy data, the next step is digging into the trends and interpreting them effectively.
Identifying Patterns in Historical Data
With historical data in hand, your goal is to uncover the trends that influence betting outcomes. A good starting point is comparing opening and closing lines alongside public betting percentages. For example, when 75% of bets favor one side but the line moves in the opposite direction, it often signals reverse line movement (RLM) and sharp betting action. By tracking these patterns over time, you can identify teams or situations that consistently trigger RLM.
Timing matters, too. Early line movements typically reflect sharp bettors capitalizing on mispriced odds, while later shifts are often driven by last-minute news or heavy public betting activity. In the NFL, pay close attention to line movements that cross key numbers like 3 or 7, as these align with common scoring margins. Recognizing these patterns can give you a competitive edge when placing your bets.
Building Line Movement into Your Betting Strategy
To craft a strong betting strategy, blend historical trends with real-time data and statistical insights. Tools like WagerProof’s Edge Finder and WagerBot Chat can help by connecting these data points, alerting you to market inefficiencies, and signaling when to fade public action. These data-driven insights clarify why certain bets hold value and can guide your decision-making process.
Professional bettors aim to beat the closing line roughly 60–70% of the time, but advanced line movement analysis can push that success rate to 75–80%. If your historical analysis confirms a positive expected value, consider adjusting your wager size - for instance, increasing from 0.9 to 1.25 units. However, avoid chasing late steam moves, as the value in those bets is often gone by the time you act.
Conclusion
How Historical Data Improves Betting Results
Historical line movement can reveal inefficiencies often overlooked by casual bettors. It helps separate public bets driven by hype from the more calculated wagers of sharp bettors who understand true value. One key concept here is reverse line movement, which highlights when informed bettors are going against the crowd. Another critical metric is Closing Line Value (CLV) - a strong indicator of long-term success. Bettors who consistently secure better odds than the final market consensus have a significant edge. While most average bettors manage to beat the closing line 60–70% of the time, those who incorporate advanced line movement analysis can increase this rate to 75–80%.
Historical data also provides an opportunity to take advantage of market overreactions to events like injuries or weather updates. These overcorrections often create contrarian betting opportunities. For professional bettors, winning more than 52% of their bets is essential just to offset the sportsbook's commission. Every small edge gained through data-driven strategies can make a big difference in building a sustainable betting approach.
Getting Started with Line Movement Analysis
To effectively analyze line movement, having access to the right tools and data is crucial. Combining reliable historical data with real-time updates is a game-changer. Platforms like WagerProof integrate historical analytics with live sports data, automatically identifying outliers and value bets. Their Edge Finder tool can alert you to mismatches in prediction market spreads, signal when to fade public action, and uncover edges that might otherwise go unnoticed.
Pay attention to bet-to-dollar ratios to spot sharp action. For instance, if a team accounts for 30% of total bets but receives 60% of the money, it’s a clear sign of professional interest. Analyzing opening and closing lines can also help you pinpoint teams that are consistently undervalued. WagerProof's tools, along with WagerBot Chat, make this process easier by connecting you to live professional data. These resources eliminate the need to manually compare odds across multiple sportsbooks. Plus, the platform’s transparent approach teaches you how to identify value, equipping you to make smarter, data-informed betting decisions.
FAQs
What is reverse line movement, and how can I spot it in real-time?
Reverse line movement (RLM) occurs when a betting line shifts in the opposite direction of where the majority of public bets are being placed. This often signals that sharp money - bets from professional gamblers - is impacting the market. If you want to detect RLM as it happens, here’s how to do it:
- Monitor opening and current lines: Pay attention to how spreads, moneylines, or totals evolve as the game nears. Shifts in these lines can reveal critical changes in the betting market.
- Compare line movement to public betting percentages: When the line moves against the majority of public bets, it’s a key indicator. For example, if the spread for the Lakers changes from -5 to -4, but 75% of bets remain on the Lakers, this suggests RLM.
- Leverage real-time alerts: Tools like WagerProof can notify you instantly when a line moves contrary to public betting patterns, allowing you to act quickly.
Recognizing reverse line movement can provide valuable insights into where sharp money is flowing. However, timing is everything - quick decisions are essential to capitalize on these market shifts.
How can I effectively analyze historical line movement trends?
To get a clear picture of historical line movement trends, you’ll need tools that provide detailed data and practical insights. The best platforms combine past odds, visual representations of line shifts over time, and analysis of the factors that drive these changes.
Take WagerProof as an example. This platform gives you access to advanced betting data, including historical statistics, prediction markets, and public betting trends. Its features help pinpoint market anomalies, detect reverse-line movement signals, and spot value opportunities. By blending real-time analytics with expert guidance, you can gain a deeper understanding of how line movements mirror market behavior and uncover opportunities for better decision-making.
Why is closing line value (CLV) important for successful sports betting?
Closing line value (CLV) is a crucial metric for measuring long-term success in sports betting. It shows whether the odds you secured were better or worse than the final market consensus. Beating the closing line - locking in odds that are more favorable than the line at game time - indicates you’ve identified value the market hadn’t fully accounted for. This often suggests you have an edge over the sportsbook. On the flip side, consistently failing to beat the closing line can result in negative expected value, even if some bets do pay off.
The closing line represents the most accurate probability of an outcome because it factors in all available information, including public betting trends, sharp money, and last-minute changes like injuries. Monitoring CLV allows you to assess your betting strategy, distinguish between skill and luck, and refine your approach to focus on bets that consistently provide value. Tools such as WagerProof make this easier by offering real-time CLV data and alerts, helping you make smarter, data-driven betting decisions.
Related Blog Posts
Ready to bet smarter?
WagerProof uses real data and advanced analytics to help you make informed betting decisions. Get access to professional-grade predictions for NFL, College Football, and more.
Get Started Free