Hit Rate vs ROI: Which Metric Matters More?
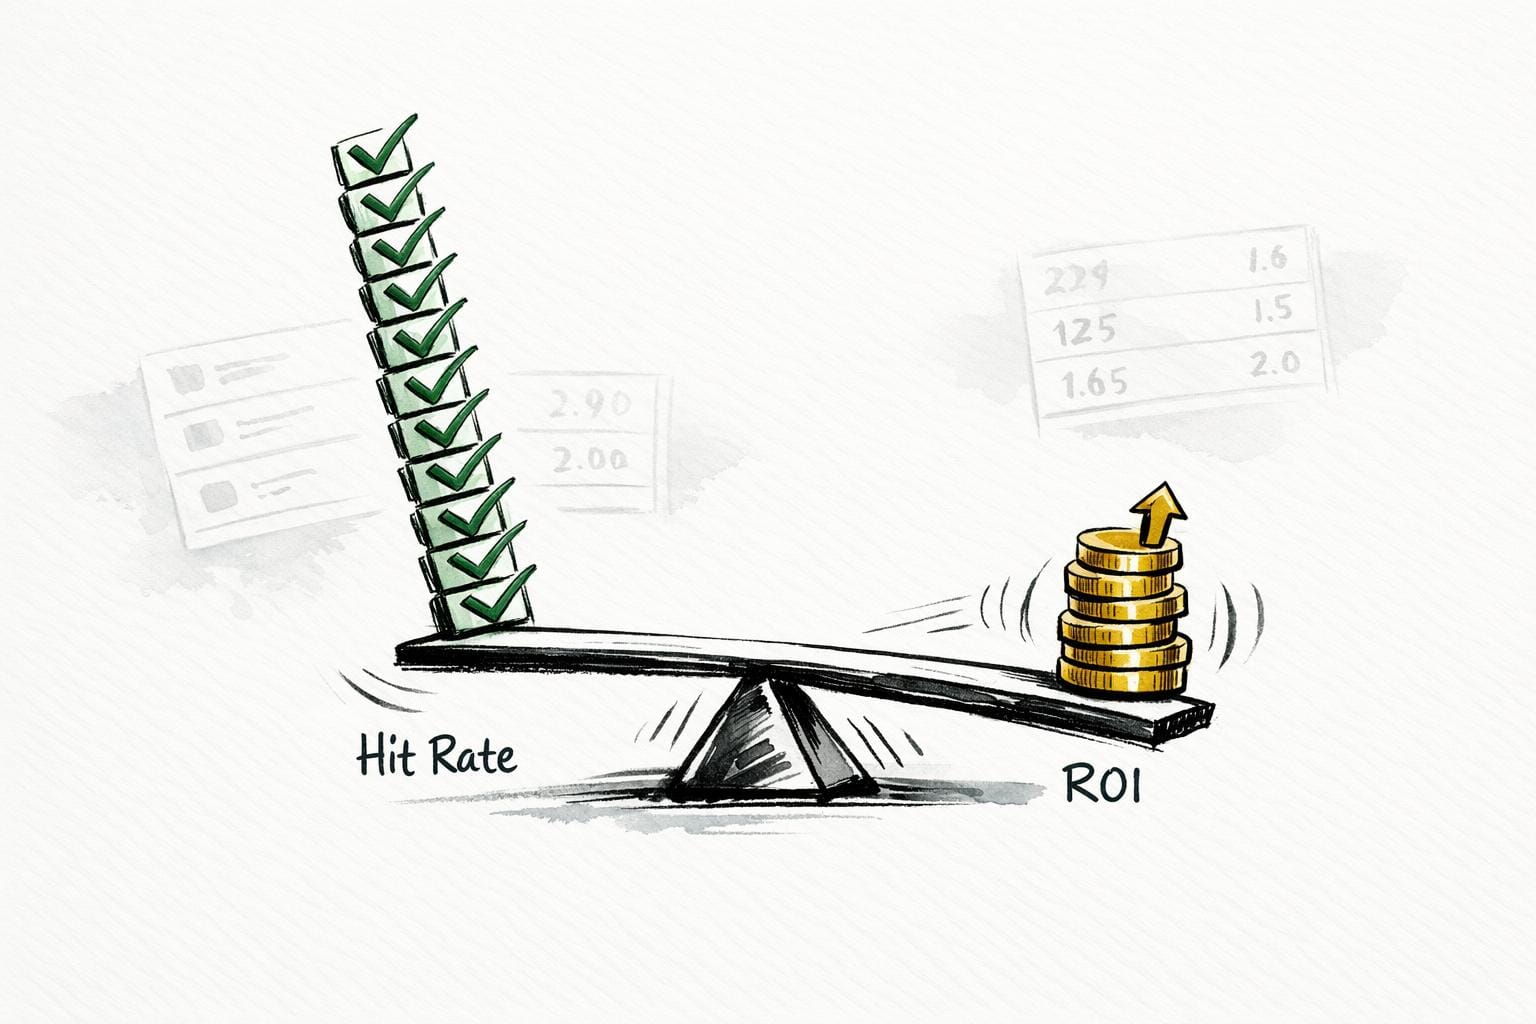
When evaluating betting models, ROI (Return on Investment) is more important than hit rate for one key reason: profitability. Hit rate shows how often you win, but it doesn’t account for the odds or payouts. ROI, however, measures how much money you actually make relative to what you wagered, making it a better indicator of success.
Here’s the difference:
- A high hit rate can still lose money if the odds are unfavorable (e.g., betting on heavy favorites).
- ROI focuses on value bets, where returns outweigh risks, even with a lower win rate.
Key Takeaways:
- Models optimized for hit rate often fail financially. A study showed accuracy-focused NBA betting models had a -35.17% ROI, while calibration-focused models achieved +34.69% ROI.
- Hit rate tracks consistency but ignores odds. ROI measures true profitability.
- Example: Winning 72% of bets on favorites might yield a 0.8% ROI, while winning 48% on underdogs could result in a 24.8% ROI.
If you’re serious about betting success, focus on ROI - it’s the metric that shows if your strategy is making money. Tools like WagerProof can help you track both metrics and refine your approach.
What Metric is Most Important in Determining a Handicapper's Success? | Sports Betting 101
What is Hit Rate?
Hit rate - sometimes referred to as "strike rate" or "win rate" - is calculated using the formula: (Number of Wins / Total Bets) × 100. For instance, if you win 55 out of 100 bets, your hit rate is 55%. Its straightforward nature and ability to provide instant feedback make it a widely-used metric in sports betting.
However, hit rate alone doesn't tell the whole story. It largely depends on the odds you're betting on. For example, a 10% hit rate on longshots at +900 odds is impressive, but a 50% hit rate on heavy favorites at -1000 is underwhelming. Most professional bettors maintain a hit rate in the 53% to 55% range when betting standard -110 lines, and anything above 56% over the long term is exceptionally rare. Bill Harrelson from ElitePickz highlights this point:
the break even winning percentage of a profitable sports bettor is typically 52.4%
when betting at standard -110 odds.
To put this into perspective, during the 2022/23 college football season, the professional handicappers at ElitePickz achieved a hit rate just shy of 55%. This resulted in a profit of 30 units - equivalent to around $3,000 for someone wagering $100 per unit. This example illustrates how even a modest hit rate in the mid-50% range, combined with disciplined bankroll management, can yield significant returns. Below, we’ll explore the strengths and limitations of this metric.
Strengths of Hit Rate
Hit rate stands out for its simplicity. It’s easy to calculate, straightforward to interpret, and offers quick feedback on how consistent your predictions are. For beginners or those focusing on a single sport, tracking hit rate can be a great way to measure improvement over time. It’s also particularly helpful for high-volume bettors. If you’re placing dozens of bets each week, your hit rate provides a clear snapshot of how often you’re making the right calls.
Limitations of Hit Rate
The main issue with hit rate is that it doesn’t consider odds or stake sizes. As Soccerwidow explains:
Hit rate has no connection with the quality of predictions
. For example, you could have a 72% hit rate by betting on heavy favorites at -250 and still barely break even. Meanwhile, another bettor with a 48% hit rate betting on underdogs at +160 might be turning a healthy profit. The metric also fails to measure value - whether you have a mathematical edge over the bookmaker’s line. Without factoring in the average odds of your bets, hit rate alone doesn’t offer a complete picture. It’s crucial to evaluate it in the context of odds and avoid making decisions based on small sample sizes, as variance can heavily skew the results.
What is ROI?
Return on Investment (ROI) is a key metric for measuring the profit you’ve earned compared to the total amount you’ve wagered. The formula is straightforward: (Net Profit / Total Wagered) × 100. For instance, if you bet $1,000 over a season and finish with $1,080, your ROI is 8%. It’s the go-to measure for assessing betting efficiency because it focuses on actual profit, not just your win rate.
Experienced bettors often consider a 5% ROI over a large number of bets as a sign of consistent profitability. As Toby, the creator of Punter2Pro, succinctly explains:
ROI reflects value, not vanity.
This is what makes ROI so useful - it accounts for both wins and the odds behind them, offering a more accurate picture of profitability than a simple win-loss record. Research even shows that models prioritizing calibration outperform those that focus solely on accuracy, resulting in higher ROI. This makes ROI a comprehensive tool for evaluating betting strategies and outcomes.
Strengths of ROI
ROI is valuable because it factors in both the odds and the size of your bets, giving you a complete view of your financial performance. For example, a bettor with a 72% win rate betting on heavy favorites at -250 odds might end up with just a 0.8% ROI. Meanwhile, a bettor with a 48% win rate who focuses on underdogs at +160 odds could achieve a 24.8% ROI. This highlights how ROI aligns with long-term profitability by showing whether your strategy is actually growing your bankroll, not just racking up wins.
Another advantage is that ROI provides a universal benchmark for comparing different strategies or models, even if they involve varying stake sizes. It forces you to focus on finding value - where your edge over the bookmaker’s line translates into real profit. As researchers Fabian Wunderlich and Daniel Memmert point out:
Betting returns should not be treated as a valid measure of model accuracy, even though they can be regarded as an adequate measure of profitability.
This distinction underscores the importance of ROI: it’s not about how often you win but whether your strategy is profitable.
Limitations of ROI
Despite its strengths, ROI has its challenges. One major issue is short-term volatility. Even successful bettors can see their ROI swing between -15% and +20% in a single month. A streak of bad luck early on can skew your ROI, making it hard to tell if your strategy is effective or if you’re just experiencing normal variance. That’s why it’s crucial to evaluate ROI over a large sample size - typically at least 200 bets - to draw meaningful conclusions.
Another limitation is that ROI doesn’t measure consistency in predictions. You could have a positive ROI even if many of your bets are incorrect, as long as your winning bets cover your losses. For this reason, ROI should be used alongside other metrics, such as units won, to get a fuller picture of your performance. Without enough context, a 5% ROI from just a handful of bets doesn’t provide much insight into your long-term betting success.
Hit Rate vs ROI: A Direct Comparison
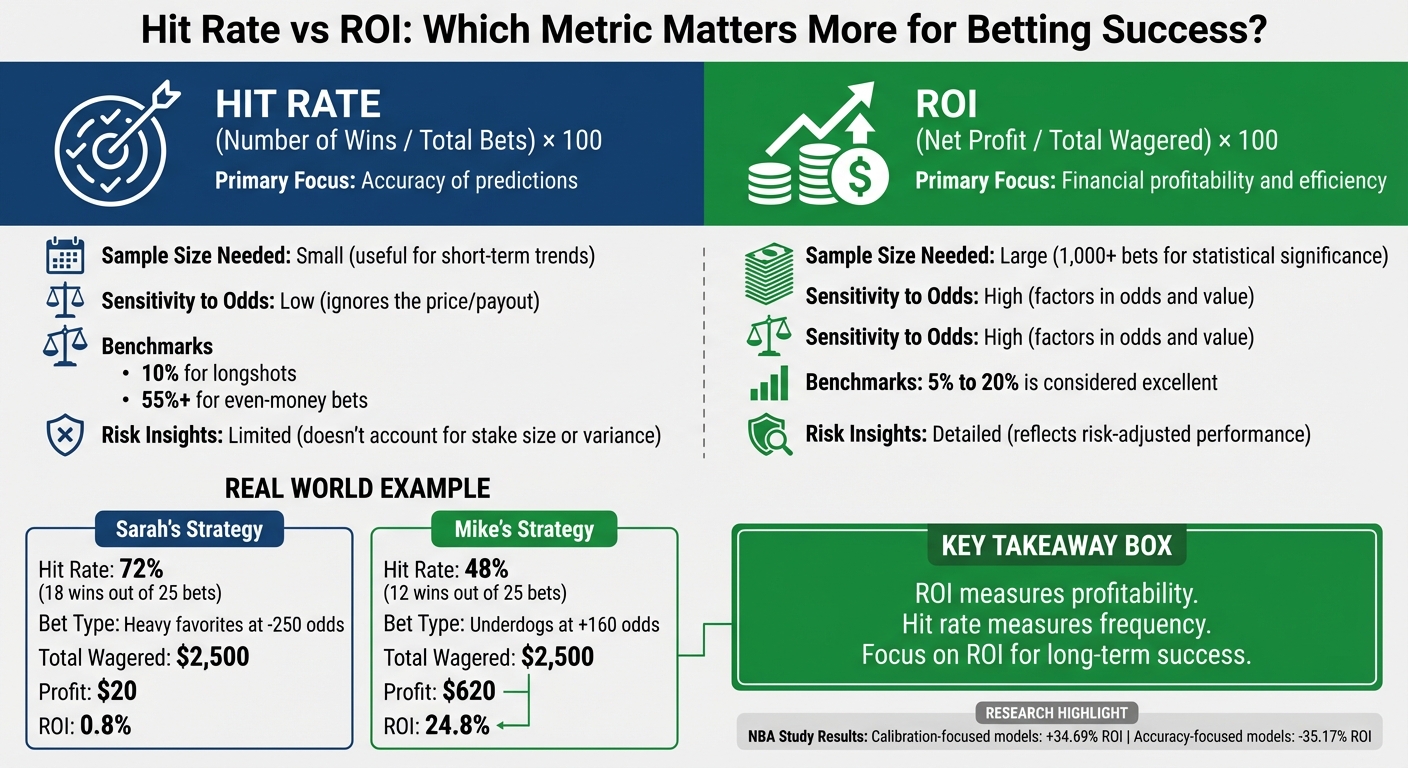
Hit Rate vs ROI: Side-by-Side Comparison for Betting Success
Hit rate measures how often you win, while ROI goes deeper, showing the actual profit by factoring in the odds. Think of hit rate as treating every win the same, no matter the payout. ROI, on the other hand, tells you if those wins are actually growing your bankroll.
Here’s why hit rate alone can be misleading. Take Sarah, for example. She won 72% of her bets in a month by betting on heavy favorites at -250 odds. Out of 25 bets, she won 18 but only earned $20 profit from $2,500 wagered - a slim 0.8% ROI. Contrast that with Mike, who bet on underdogs at +160 odds. Even with a lower win rate of 48% (12 wins and 13 losses), he made $620 profit on the same $2,500 wagered, achieving a 24.8% ROI. The numbers tell the story: ROI paints a clearer picture of profitability.
Comparison Table: Hit Rate vs ROI
Here’s a side-by-side breakdown of hit rate and ROI:
| Aspect | Hit Rate (Win Rate) | ROI (Return on Investment) |
|---|---|---|
| Calculation Method | (Winning Bets ÷ Total Bets) × 100 | (Net Profit ÷ Total Amount Wagered) × 100 |
| Primary Focus | Accuracy of predictions | Financial profitability and efficiency |
| Required Sample Size | Small (useful for short-term trends) | Large (1,000+ bets for statistical significance) |
| Sensitivity to Odds | Low (ignores the price/payout) | High (factors in odds and value) |
| Benchmarks | Varies by bet type (e.g., 10% for longshots, 55%+ for even-money) | 5% to 20% is considered excellent |
| Risk Insights | Limited (doesn't account for stake size or variance) | Detailed (reflects risk-adjusted performance) |
The table highlights the key takeaway: hit rate is handy for gauging prediction accuracy, but ROI is the ultimate measure of profitability. A 55% hit rate might look impressive, but it doesn’t guarantee meaningful returns. ROI cuts through the noise, showing whether your strategy is actually paying off. Up next, we’ll dive into how WagerProof’s tools can help you track and analyze these metrics effectively.
Why ROI Matters More for Betting Model Validation
When it comes to evaluating betting models, ROI (Return on Investment) tells a far more important story than hit rate alone. Sure, hit rate shows how often you win, but it doesn’t show whether those wins are actually profitable. ROI, on the other hand, focuses on the profit per dollar risked. This distinction is crucial because a high win rate can still lead to losses if the wins are small and the occasional losses are massive. For example, a model with a 90% win rate might win $10 nine times but lose $150 on a single bet, resulting in a net loss of $60. Hit rate alone misses this imbalance, making ROI the better tool for understanding profitability.
Models calibrated for ROI consistently outperform those focused purely on accuracy. Take the NBA betting study as an example: calibration-based models achieved an average ROI of +34.69%, while accuracy-focused models showed an average ROI of –35.17%. This proves that picking winners frequently doesn’t necessarily lead to profit.
"The market doesn't pay for being right often; it pays for being right when it's underpriced." - Polyburg Blog
Let’s break it down further. Imagine Trader A, who wins 90% of their bets but loses money because their occasional losses outweigh their small wins (nine wins at $10 each and one loss at $150, leading to a $60 net loss). Now compare that to Trader B, who wins less often but focuses on value bets - three wins at $200 each and seven losses at $50 each, resulting in a $350 net profit. The difference? Trader B prioritizes value over frequency, which makes all the difference in profitability.
Professional bettors understand this well. Long-term success comes from identifying value bets - those where the potential payout exceeds the true probability of the outcome. Even small adjustments can make a big impact. For instance, shopping around for better odds (like finding -105 instead of -110) can improve annual ROI by 2% to 3%.
When validating a betting model, ROI provides a clearer and more reliable measure of whether your model has a genuine edge or if it’s just benefiting from cherry-picked results. This emphasis on value is why tools like WagerProof are so useful, helping bettors track and refine these critical metrics.
Using WagerProof to Track Hit Rate and ROI

Tracking your hit rate and ROI is crucial for understanding your betting performance, and WagerProof makes this process effortless. By automating the tracking process, WagerProof removes the need for clunky spreadsheets and guesswork. Instead, it provides advanced analytics to pinpoint where you're gaining an edge - and where you're not. These tools integrate seamlessly with WagerProof's broader analytical suite.
One standout feature is the Edge Finder, which highlights market inefficiencies by flagging mismatched prediction market spreads. This helps you focus on bets with real value instead of chasing high win rates that may not lead to profits. Meanwhile, Historical Analytics allows you to assess the long-term stability of your performance. By tracking both ROI and hit rate over time, you can determine if your model consistently holds up or if it's just riding a lucky streak.
The AI Game Simulator adds another layer of precision by testing your predictions against actual outcomes. This helps refine your model’s probabilities, and in optimal scenarios, a well-tuned model can achieve an ROI of up to 36.93%. Additionally, WagerBot Chat offers real-time prediction validation, using live professional data to ensure you're working with the latest insights - not outdated information.
WagerProof’s multi-model system reduces the risk of overfitting while improving its ability to detect value. In high-confidence scenarios, the platform can deliver up to 84% accuracy with a positive ROI potential of +34.69%. By automating data management, WagerProof frees up your time, letting you focus on making smarter, more informed bets.
Conclusion
While hit rate might highlight consistency, it's ROI that truly reveals profitability. A high win rate can be misleading - if the odds are unfavorable, even frequent wins might result in minimal gains. On the other hand, lower win rates on value bets can deliver impressive ROI.
"The hit rate, no matter how high, says absolutely nothing about potential and/or realised gains or losses." - Soccerwidow, Founder of Soccerwidow
ROI is the ultimate measure of success in betting because profit is what sustains long-term performance. Research on NBA betting models backs this up: models chosen for their calibration (accuracy in predicting probabilities) achieved an average ROI of +34.69%. In contrast, models selected based on hit rate alone led to an average loss of -35.17%. This shows that focusing solely on wins, without considering value, is a recipe for failure. These findings make it clear why shifting focus from hit rate to ROI is not just practical but essential for effective betting.
WagerProof simplifies this shift by automatically tracking both hit rate and ROI, helping you pinpoint where you're gaining real value and where you're falling short. With tools like the Edge Finder and Historical Analytics, the platform enables you to prioritize bets with a mathematical edge rather than chasing flashy win rates. These features align perfectly with the research, proving that value - not vanity - should guide your betting strategy.
If building wealth is your goal, focus on ROI instead of just counting wins. Use WagerProof’s data-driven tools to refine your approach and ensure every bet you place has the potential to grow your profits.
FAQs
What ROI is considered good in sports betting?
A solid ROI in sports betting usually falls between 4% and 10%. If you’re hitting above 5%, that’s often considered excellent and something you can sustain long-term. Consistently keeping your ROI in the positive range is a clear sign that your betting strategy is working effectively.
How many bets are needed for ROI to be reliable?
To get a dependable measure of ROI, you should monitor at least 100 bets. However, for a more precise and reliable analysis, tracking between 200 and 500 bets is ideal. A larger sample size reduces the impact of variability, giving you a better understanding of your betting performance over time.
Can a low hit rate still be profitable?
Profitability in betting hinges more on odds and payouts than the frequency of winning bets. A bettor with a low win rate can still see a positive ROI by targeting high-value bets with favorable odds. Relying only on win rate can be deceptive, as long-term success is better gauged by ROI, which factors in both the magnitude of wins and losses.
Related Blog Posts
Ready to bet smarter?
WagerProof uses real data and advanced analytics to help you make informed betting decisions. Get access to professional-grade predictions for NFL, College Football, and more.
Get Started Free