How AI Tracks Player Possession Value
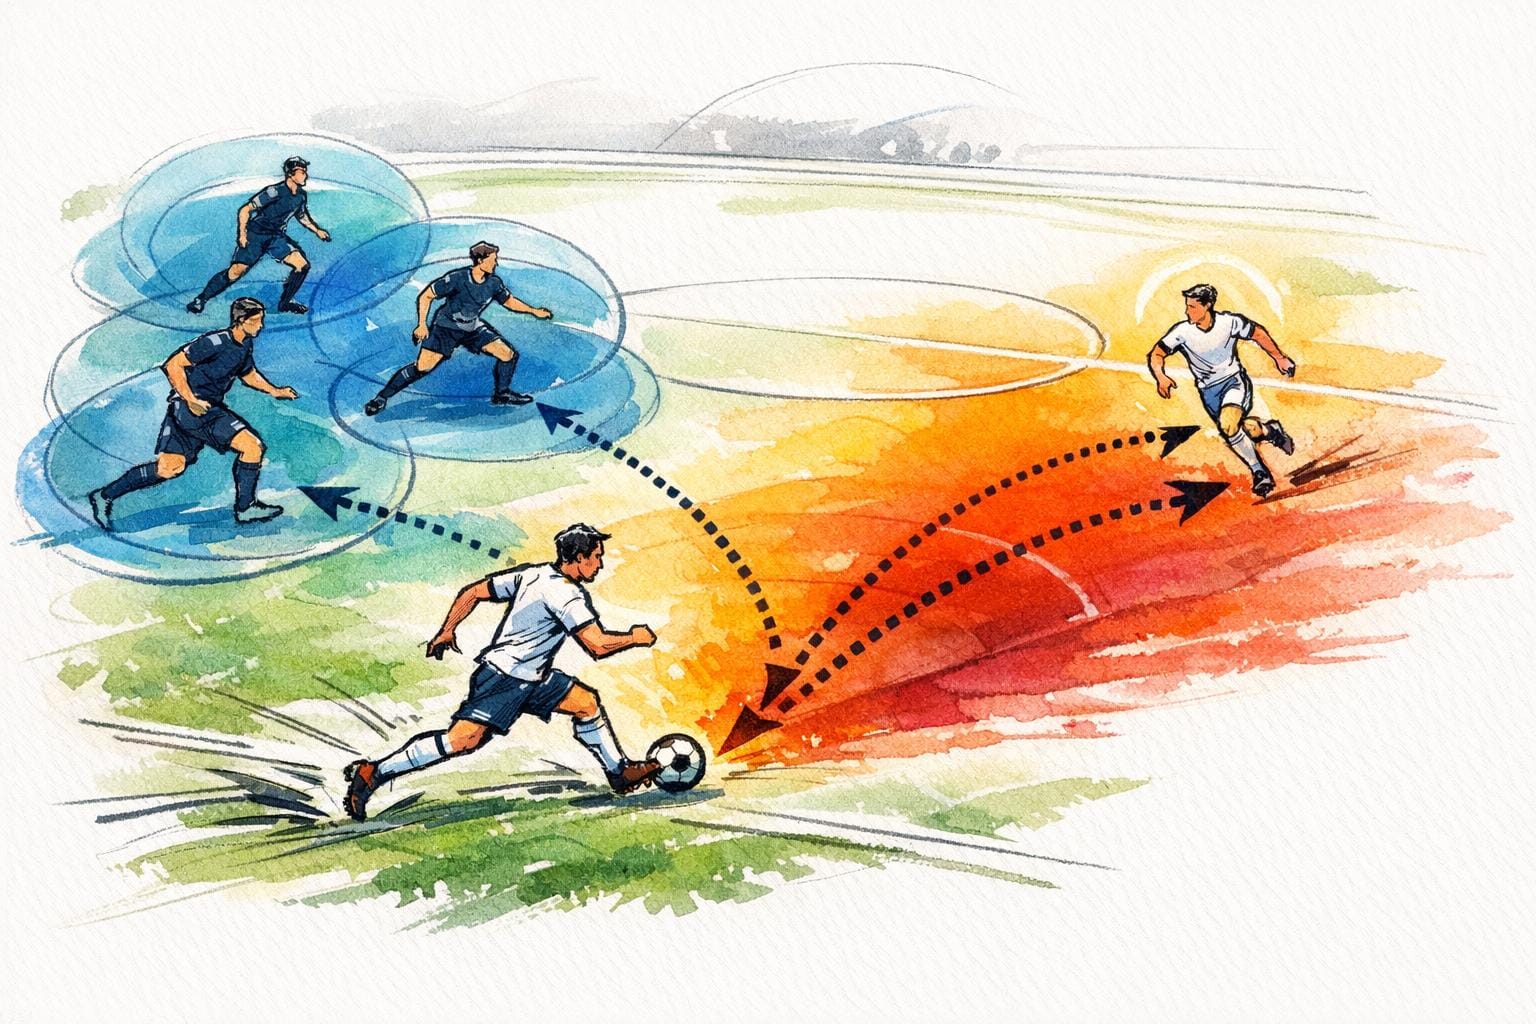
AI is changing how soccer performance is analyzed by assigning measurable value to every action on the field. Possession Value (PV) calculates how much a player's actions - like passes, tackles, or runs - impact their team's chances of scoring within a specific timeframe, such as the next 10 seconds. Unlike traditional stats (e.g., goals, assists), PV highlights contributions often overlooked, such as progressive passes or defensive interceptions.
Key advancements include:
- AI-Powered Metrics: Models like Expected Possession Value (EPV) and Expected Threat (xT) use spatiotemporal tracking data to evaluate game states in real time.
- Player Tracking: Computer vision and multi-object tracking systems analyze player and ball movements at high frequencies (up to 25Hz), providing frame-by-frame insights.
- Improved Predictions: EPV-based models predict match outcomes with 58.3% accuracy, outperforming older Expected Goals (xG) models.
- Hidden Contributions: AI reveals the impact of players like midfielders and defenders, whose actions are often missed in traditional statistics.
These tools help teams refine tactics, identify high-impact players, and even guide betting decisions by analyzing risks and scoring opportunities in unprecedented detail.
Beyond pitch control: valuing player actions and passing options.
How Possession Value Metrics Have Changed
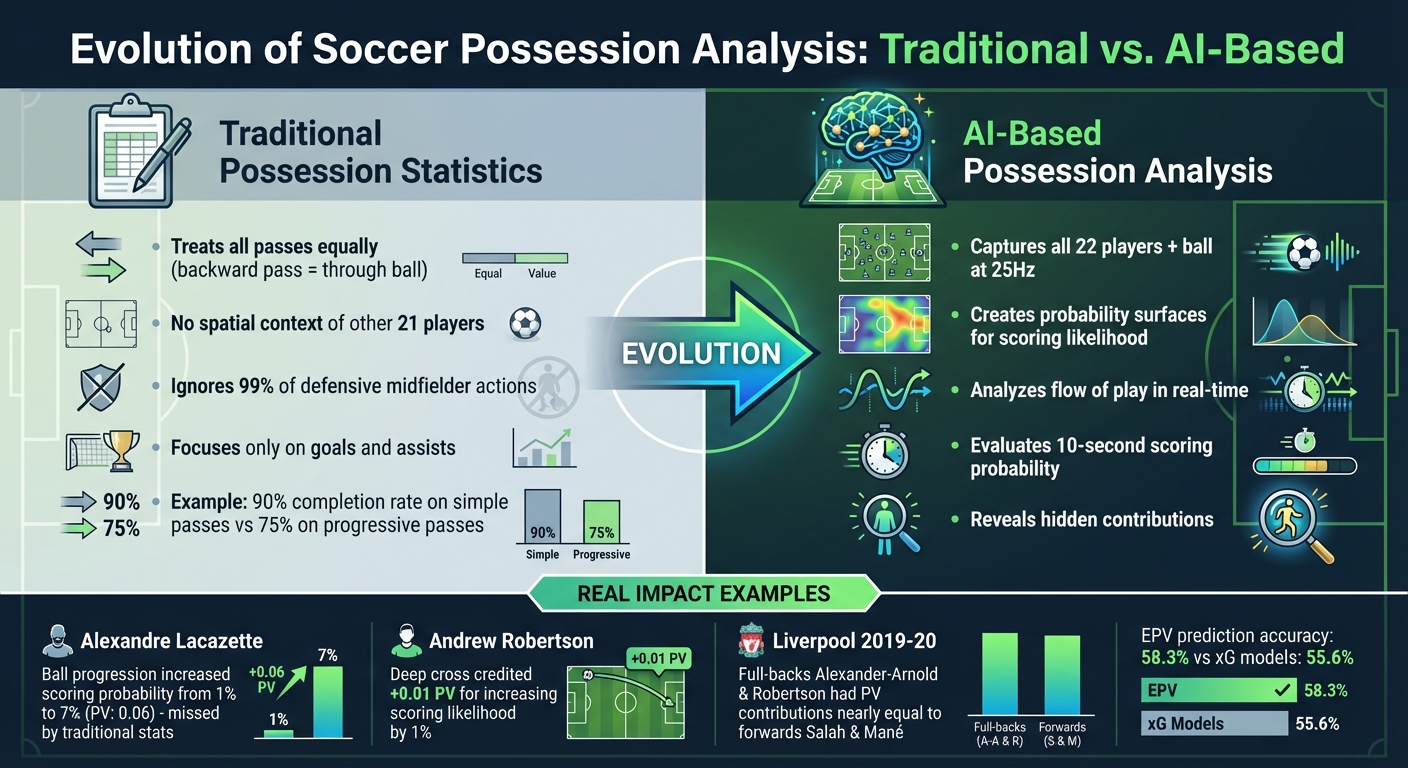
Traditional vs AI-Based Soccer Possession Metrics Comparison
Why Traditional Possession Statistics Fall Short
Traditional possession metrics often fail to tell the full story. For instance, a pass completion rate treats all completed passes equally - whether it’s a cautious backward pass or a bold, defense-splitting through ball. This means a midfielder with a 90% completion rate on simple sideways passes can seem more effective than a playmaker completing high-risk, progressive passes at 75%.
Another issue is the lack of spatial context in standard event data. While these metrics note where and when an action happens, they don’t account for the positioning of the other 21 players on the field. A pass into the final third has vastly different implications depending on whether the opposition is defensively organized or caught off guard. Stats Perform highlights this problem:
"Focusing on [goals and assists] in isolation ignores all other actions on the pitch. For example, how are we supposed to properly assess the on-the-ball skills of a defensive midfielder if we disregard 99% of all the actions they make?"
Take Alexandre Lacazette as an example. In one match, his ball progression increased Arsenal’s scoring probability from 1% to 7%, generating a Possession Value of 0.06. Traditional metrics completely overlooked this contribution. This is where AI-based analysis steps in to fill the gaps.
Moving to AI-Based Possession Analysis
AI models address these shortcomings by providing a deeper, time-sensitive understanding of the game. Using spatiotemporal tracking data, these systems capture the positions of all 22 players and the ball at 25Hz, creating a "probability surface" that evaluates scoring likelihood at every moment. Instead of isolating events, AI models analyze the flow of play in real time.
This shift to time-based frameworks marks a major evolution in how possession is measured. For example, Stats Perform’s Possession Value framework evaluates a team’s 10-second scoring probability, rewarding players for moving the ball into more dangerous areas. Consider a moment from September 2020: Liverpool’s Andrew Robertson sent a deep cross against Arsenal that was cleared by a defender. The AI model credited him with a positive 0.01 PV+ because the clearance landed in a central area, increasing Liverpool’s scoring likelihood by 1% over the next 10 seconds. This shows how AI can quantify contributions that traditional metrics would ignore.
This approach also shines a light on unsung heroes. During Liverpool’s 2019–20 season, full-backs Trent Alexander-Arnold and Andrew Robertson posted Possession Value contributions nearly on par with forwards Mohamed Salah and Sadio Mané. Traditional assist statistics would have severely underestimated their impact. With these insights, teams can make smarter tactical decisions in real time.
How AI Tracks Player and Ball Movement
Building on AI-based possession analysis, let’s dive into how real-time tracking captures the movement of players and the ball during a game.
Computer Vision and Multi-Object Tracking
AI systems use computer vision to identify and follow every player and the ball as the game unfolds. Single-stage detectors, like YOLOv8, can process live footage at speeds of over 60 FPS, while two-stage models, such as Faster R-CNN, operate at a slower rate of 3–10 FPS.
Tracking the ball comes with its own set of challenges. In 4K footage, the ball might appear as a tiny object, covering less than 10×10 pixels. To address this, AI systems divide frames into tiles and utilize heatmap detection methods. Algorithms like TrackNetV2 analyze consecutive frames to map the ball's trajectory, achieving precision rates above 97%.
For players, multi-object tracking (MOT) algorithms ensure identities remain consistent, even when players are obscured or overlap. For instance, ByteTrack links low-confidence detections to existing tracks, while OC-SORT focuses on motion patterns to handle sudden direction changes. These techniques prevent errors, such as confusing players wearing identical uniforms.
Pose Estimation for Player Positioning
Standard tracking shows where a player is on the field, but pose estimation goes a step further by revealing how they are moving. This allows AI to analyze player orientation, which is crucial for understanding actions like receiving passes or controlling specific zones.
"Tracking tells you where a player is. Pose estimation reveals how they're moving." - Raymond F, Product Author
Pose estimation also feeds into pitch control models, helping calculate a player’s ability to reach a specific point before anyone else. For example, a sprinting player might have a better chance to dominate space ahead, even if they’re farther away initially. Advanced tools like Meta's VideoPose3D transform 2D keypoint data from a single camera into 3D skeletons. This enables detailed biomechanical analysis, such as evaluating joint angles or movement efficiency.
Real-Time Data Processing for Live Games
Processing this wealth of information during live games demands serious computational power. For instance, an NBA AI system running on AWS handles approximately 2,500 events per second across 10 simultaneous games. This system integrates 25 FPS tracking data with event-based actions like shots or turnovers.
To ensure accuracy, Camera Motion Compensation separates player movement from camera panning by locking onto static field features. Temporal inertia further stabilizes predictions by averaging results over 10–20 frames, reducing errors caused by occlusions.
Currently, these systems manage data at a rate of 15 MB per second. Complex metrics, such as shot difficulty, can be calculated within 10–12 seconds, though developers are working to achieve subsecond processing times.
AI Models That Calculate Possession Value
Once AI systems capture the movement of players and the ball, the next step is turning that raw data into actionable insights. This is where specific frameworks come into play, assigning numerical values to every action on the field. These metrics reveal contributions that traditional stats often overlook, offering a clearer picture of both individual and team impact.
Expected Threat (xT) and Possession Zones
Expected Threat (xT) is one such framework, breaking the pitch into a grid - commonly 16×12 or 12×8 - and assigning each cell a goal probability based on historical data. Zones closer to the opponent's penalty box naturally carry higher xT values compared to those near midfield.
Using a Markov process, xT evaluates the potential threat in each zone. Players earn credit when they move the ball from a lower-value zone to one with higher xT. For instance, if a midfielder passes from a zone with an xT of 0.02 to one with an xT of 0.08, they earn a +0.06 xT rating for that action.
Other advanced models, like VAEP (Valuing Actions by Estimating Probabilities), expand on this by analyzing over 36 action types, including defensive moves like tackles and interceptions. Players such as Lionel Messi and Kevin De Bruyne often post VAEP scores between +0.50 and +0.90 per 90 minutes, showcasing their consistent influence on the game. During the 2019/2020 Premier League season, Stats Perform's Possession Value framework highlighted Riyad Mahrez and Kevin De Bruyne as top performers due to their ability to add significant "Possession Value Added" (PV+) through progressive actions.
"The threat lies in how the ball is moved, rather than where the ball is. A pass does not just have value because of where the ball ends up, it also has value on how it shifts the defense." - DTAI Sports
Pitch Control and Player Influence
Pitch control analysis takes things a step further by examining which players control specific zones of the field at any given moment. This approach uses high-frequency tracking data - often at 25 Hz - to align player and ball positions, factoring in speed, direction, and proximity. For example, a sprinting attacker might control space ahead of them, even if they're not closest to the ball.
This model evaluates possession through a risk-and-reward perspective. The reward is the probability of scoring, represented by Expected Possession Value (EPV), while the risk is the likelihood of the defending team regaining the ball, termed Expected Ball Gain (xBG).
In a Liverpool vs. Arsenal match, Virgil van Dijk demonstrated this concept by recording the third-highest net Possession Value added (0.36 PV+). His score came from "press-evading long balls" that boosted his team's scoring chances - actions traditional metrics often overlook. In a study of three Bundesliga seasons, EPV-based pre-match predictions showed an accuracy of 58.3%, outperforming xG-based models, which stood at 55.6%.
"The attacking team's reward of scoring can be determined by the magnitude of EPV, while the attacking team's risk to lose ball possession can be evaluated by the size of the opposing xBG." - Leander Forcher, Researcher, Karlsruhe Institute of Technology
How AI Turns Data Into Actionable Insights
AI transforms raw tracking data into practical insights that coaches and analysts can use to refine their strategies. By processing spatiotemporal data at speeds of up to 25Hz, it produces frame-by-frame Expected Possession Value (EPV) estimates that go beyond traditional statistics. These insights build on earlier AI tracking methods, offering tools that directly support tactical decision-making.
Shape Analysis and Tactical Adjustments
AI helps coaches by identifying patterns like "formation blocks" and "dynamic pressure lines" through real-time clustering of player positions. This gives immediate feedback on team compactness and defensive structure. For example, if defensive lines become too stretched, the system flags potential vulnerabilities. Probability surfaces provide a full-field view, highlighting open players and valuable passing lanes that might otherwise go unnoticed. These visual tools are especially useful during post-match reviews. Coaches can analyze instances where players opted for a low-probability shot instead of a better passing option. The system even breaks down EPV into components - passes, ball drives, and shots - making it clear which decisions could have boosted scoring chances.
Player Heatmaps and Efficiency Metrics
AI doesn’t stop at formations - it also delivers visual metrics that reveal team territory and efficiency. Pitch control maps, for instance, show which team dominates certain zones at any moment, helping coaches spot areas where they may be conceding too much space. These maps merge player position and density data to offer a clear picture of territorial dominance. Analysts often pair xG (expected goals) with EPV to spot teams that aren’t converting quality chances into goals. This can signal a likely improvement in future performance, as teams with strong build-up play but poor finishing often see positive shifts over time. By combining these metrics, analysts can separate teams that pose real scoring threats from those that simply maintain possession without creating danger.
Defensive Weaknesses and Counter-Attack Risks
Building on pitch control analysis, AI also helps identify defensive gaps and counter-attack vulnerabilities. For example, opponent ball-progression heatmaps can guide coaches on where to apply high-intensity pressing to disrupt key possession chains. AI models compare each possession’s EPV with defensive Expected Ball Gains (xBG) to evaluate the risks and rewards of pressing. This contrast helps pinpoint optimal moments for aggressive defensive actions. Additionally, AI trained on offensive transitions can predict the success of counter-attacks within a 10-second window, helping teams anticipate when they might be most exposed to quick strikes. These insights provide a detailed risk-reward framework for managing defensive and offensive transitions effectively.
What's Next for AI in Sports Analytics
AI is pushing possession value analytics to new levels, moving beyond what was possible just a year ago. The focus has shifted from basic location-based metrics to real-time, context-aware models, revolutionizing how teams evaluate players and how bettors spot opportunities. Modern tracking systems now capture data at an impressive 50 Hz, while specialized instrumented balls track movement at a staggering 500 Hz. This level of detail offers deeper insights and builds on earlier tracking methods. Top leagues are already adopting these advancements, and it's likely they'll soon be the norm across sports data platforms. These changes are powered by improvements in real-time data processing.
Improving Real-Time Capabilities
AI frameworks are now advancing toward continuous, frame-by-frame analysis, significantly reducing the lag between on-field actions and analyst observations. In August 2025, researchers David Hirnschall and Robert Bajons demonstrated the effectiveness of a path signature-based possession metric using data from the 2017/18 Premier League season. This approach proved more reliable than transformer-based models.
"The frame-by-frame estimation of EPV constitutes a one-dimensional time series that provides an intuitive description of how the possession value changes in time."
- Javier Fernandez, Luke Bornn, and Dan Cervone
In February 2025, another study made waves by introducing a U-Net architecture. Using data from Dutch Eredivisie matches and the 2022 FIFA World Cup, the model improved Expected Calibration Error in EPV calculations and accurately identified high-value game states 78% of the time. These models now analyze ball height and other 3D data, offering a clearer picture of the risks and rewards of aerial versus ground passes. These advancements not only enhance in-game decision-making but also open up new possibilities for betting analytics.
Using Possession Value for Betting Insights
For sports bettors, AI-driven metrics expose inefficiencies in the betting market. These tools provide a predictive advantage, particularly in cases where teams with strong build-up play fail to capitalize on scoring opportunities.
WagerProof is one platform harnessing these advancements. It highlights transparency-driven insights that flag situations where a team’s high EPV isn’t translating into goals due to poor finishing - a potential "buy low" scenario for bettors. By integrating real-time pitch control and Expected Threat (xT) overlays, WagerProof offers live insights into which team is dominating tactically during a match. Unlike platforms that provide predictions without context, WagerProof uses AI-powered possession value data to explain why a bet has potential, helping users identify edges that might otherwise go unnoticed.
FAQs
What’s the difference between PV, EPV, and xT?
Possession Value (PV) evaluates the effect of individual actions within a possession, determining how much they improve or reduce scoring opportunities. Expected Possession Value (EPV) focuses on the value of possession states over time, analyzing sequences of actions. Expected Threat (xT) takes a location-based approach, assigning value to actions that move the ball into areas with greater scoring potential, though it often overlooks defensive contributions and shots.
How does AI value defensive actions like interceptions?
AI assesses defensive plays, like interceptions, by examining how they influence the game's momentum and reduce potential threats. For instance, models like Defensive Action Expected Threat (DAxT) measure the value of these actions based on their ability to lower the opponent's scoring opportunities. Similarly, possession value models evaluate how defensive moves disrupt or reset offensive strategies, assigning importance to these actions by calculating their impact on reducing the chances of conceding a goal.
How can possession value help with live betting decisions?
Possession value plays a key role in live betting by estimating how likely a team is to score or create chances based on the game's real-time dynamics. AI models evaluate actions such as passes, dribbles, or turnovers, assigning values to these possession changes to highlight scoring probabilities.
By monitoring these subtle shifts in gameplay, bettors can identify opportunities with higher potential, whether it's predicting the next goal scorer or the match winner. This data-driven approach allows for more informed and strategic decisions during live games.
Related Blog Posts
Ready to bet smarter?
WagerProof uses real data and advanced analytics to help you make informed betting decisions. Get access to professional-grade predictions for NFL, College Football, and more.
Get Started Free