How Pros Use Historical Data for Betting Edge
Want to bet smarter? Start using historical data. Professionals in sports betting don’t rely on gut feelings or fandom. Instead, they use data to spot trends, price odds, and identify value. By analyzing team performance under specific conditions like weather, travel, and matchups, they uncover patterns casual bettors miss.
Key takeaways:
- Historical data reveals trends: Metrics like Expected Goals (xG) in soccer or Offensive Rating in basketball highlight performance beyond win-loss records.
- Focus on value, not winners: Pros calculate probabilities and compare them to sportsbook odds to find mispriced bets.
- Combine data with context: Real-time updates (injuries, weather, etc.) refine predictions during games.
- Advanced tools help: Platforms like WagerProof use predictive models and simulations to flag betting opportunities.
Sports Betting & Statistics | How To Use Historical Data To Predict Sports Results
Finding Patterns and Trends in Historical Data
Once you grasp how professionals approach market pricing, the next step is learning to identify meaningful patterns in years of game data. This involves combing through thousands of matchups to uncover trends that can forecast future outcomes - separating valuable insights from mere noise. By building on professional pricing strategies, this process helps uncover actionable betting signals.
Analyzing Trends for Recurring Patterns
Finding valuable patterns requires digging deeper than basic win-loss records. Professionals focus on performance metrics that reveal consistent success rather than luck. Each sport has unique metrics that help in this analysis. For instance:
- Soccer: Metrics like Expected Goals (xG) measure the quality of scoring chances a team generates. A team with high xG but few actual goals is often a "buy" signal - they're performing well but have been unlucky. Conversely, teams winning with low xG are likely to regress - making them "sell" signals.
- Basketball: Key metrics include Offensive Rating (points scored per 100 possessions) and Effective Field-Goal Percentage (eFG%), which adjusts shooting accuracy to account for the extra value of three-pointers. These metrics provide a clearer picture of team efficiency than simple records.
- Baseball: For pitchers, WHIP (Walks + Hits per Inning Pitched) is a more reliable indicator of performance than win-loss stats.
Another essential factor is roster continuity. Professionals generally trust historical data only from the past 1–2 seasons if at least 70% of a team’s roster remains unchanged. Significant roster changes often mean older data is less relevant, as the team may essentially be starting from scratch.
Professionals also account for situational tendencies that casual bettors might overlook. For example, some NFL teams follow predictable performance patterns over a 17-week season, while younger college basketball teams often improve significantly as the season progresses. Coaching styles also play a role - some coaches excel at halftime adjustments, while others struggle with short rest or long travel schedules.
Case Study: Using Long-Term Trends
Take the May 2024 NBA playoff matchup between the Cleveland Cavaliers and Boston Celtics as an example. Analysis of Boston's Defensive Rating and Effective Field-Goal Percentage revealed a key insight: Boston averaged 17.4 three-pointers per game. By diving deeper into shot-location data and Cleveland’s corner defense, analysts spotted an opportunity for a prop bet on Boston exceeding 17 three-pointers. This wager paid off because the analysis went beyond surface-level stats.
This case highlights how multi-factor analysis sets professionals apart. Instead of relying on a single stat, pros combine factors like team efficiency, player matchups, and situational dynamics to form a complete picture. This approach ensures they identify genuine edges rather than chasing trends that won’t hold up over time.
Using Situational and Contextual Data
How Situational Factors Impact Sports Betting Performance
Historical trends lay the groundwork, but context determines if those patterns still hold up today. Professional bettors don't stop at past data - they dig into situational details like injuries, weather conditions, and travel schedules to uncover where the betting market might have miscalculated.
Head-to-Head Matchup Analysis
Head-to-head records are more than just a tally of wins and losses. Professionals go deeper, analyzing efficiency metrics to see how teams fare against each other's specific styles of play. Take Jalen Hurts, for example - his 101.9 quarterback rating against the Commanders highlights a matchup advantage that standard season stats might not reveal.
To keep the insights relevant, pros focus on the last 3–5 matchups, ensuring the data reflects current rosters and strategies. A team that’s won five of its last six head-to-head games may seem dominant, but if all those wins came at home, that’s venue bias, not a true competitive edge.
Another key metric is ATS Margin, which measures how teams perform relative to betting market expectations. Professionals also look for Defensive Matchup Discrepancies - situations where one team’s defensive shortcomings align perfectly with an opponent’s offensive strengths. Think of it like a tennis player struggling against heavy-topspin forehands or a quarterback consistently failing against a specific secondary.
Of course, even the best head-to-head data can be influenced by external conditions.
External Factors: Injuries, Weather, and Venue
While head-to-head stats are crucial, external factors often have the final say. For instance, NBA teams playing the second game of a back-to-back average 0.75 points below the closing point spread - a clear disadvantage. In the NFL, Thursday Night Football games often favor home teams because the short preparation time hits the visitors harder.
Injury analysis isn’t just about who’s out - it’s about how well the team adjusts with replacements and tactical changes. Weather is another game-changer. High winds can disrupt the passing game in football, and extreme cold often shifts offenses toward running plays, making "under" bets more attractive.
Venue advantages also vary widely. Some teams thrive on the energy of a home crowd, while others show little difference in performance between home and away games. Historical splits help pros pinpoint which teams genuinely benefit from home-field conditions.
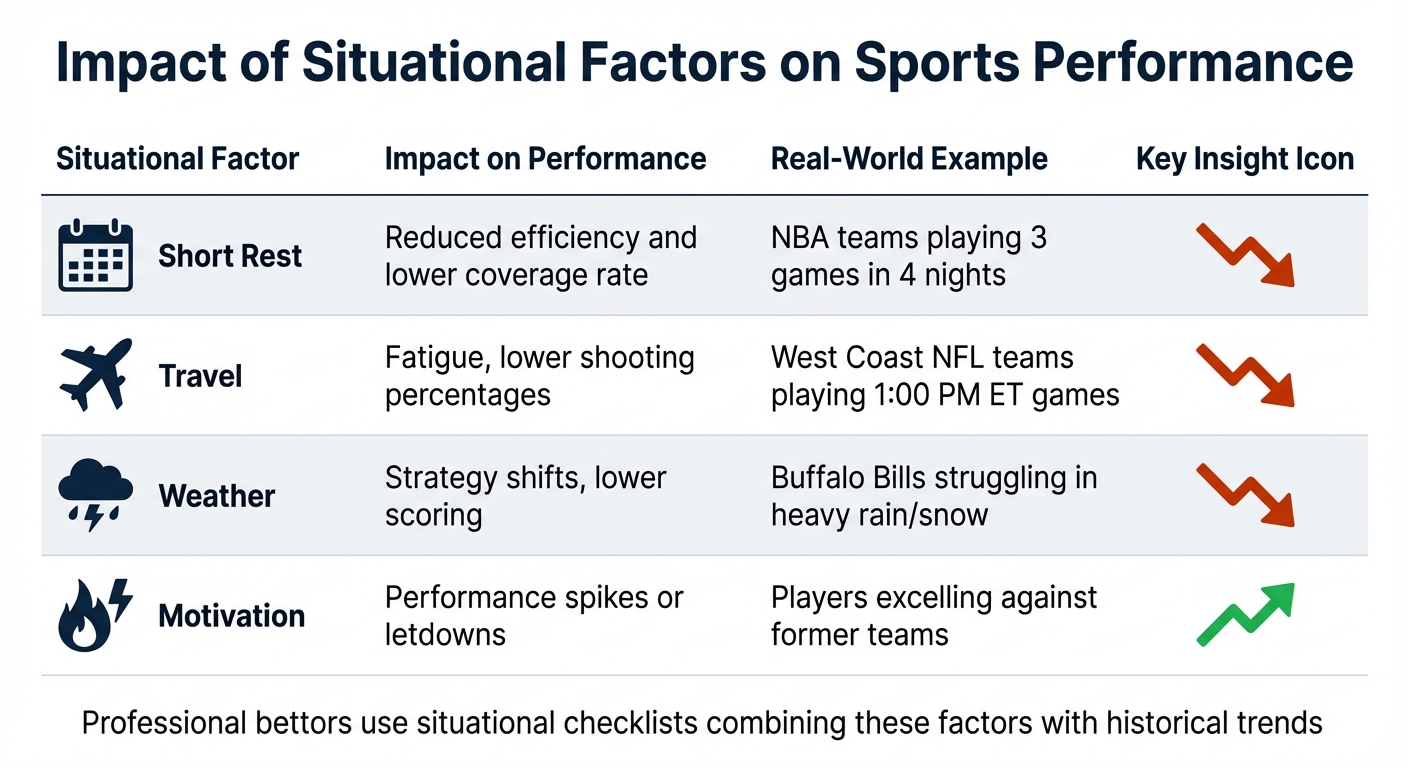
| Situational Factor | Impact on Performance | Example |
|---|---|---|
| Short Rest | Reduced efficiency and lower coverage rate | NBA teams playing 3 games in 4 nights |
| Travel | Fatigue, lower shooting percentages | West Coast NFL teams playing 1:00 PM ET games |
| Weather | Strategy shifts, lower scoring | Buffalo Bills struggling in heavy rain/snow |
| Motivation | Performance spikes or letdowns | Players excelling against former teams |
Professionals rely on a situational checklist that includes recent form, head-to-head records, injury updates, weather forecasts, and travel schedules. By combining these situational insights with historical trends, they sharpen their ability to spot mispriced bets and gain an edge. For more sports betting insights, explore our latest analysis.
Advanced Tools and Statistical Models
Professionals in the sports betting world have taken their game to the next level by using advanced models to uncover patterns that aren't immediately obvious in raw data. By processing historical data through predictive models, they can identify trends that casual bettors often miss. These tools are what separate the occasional bettor from those who consistently find value.
Predictive Models and Machine Learning
Machine learning algorithms are particularly effective at managing the nonlinear relationships often found in sports data. Techniques like Gradient Boosted Trees, XGBoost, and Random Forests are popular because they can handle multiple complex variables - like matchup deltas and situational factors - simultaneously.
That said, accuracy isn’t the sole metric for success. Professionals focus on calibration - ensuring that a 70% predicted win probability aligns with actual outcomes 70% of the time. A June 2024 study on NBA betting revealed that models chosen for their calibration delivered a return on investment of +34.69%, compared to just +5.56% for accuracy-focused models.
"For the sports betting problem, model calibration is more important than accuracy." - Conor Walsh, Department of Computer Science, University of Bath
To optimize predictions, advanced bettors blend their calibrated models with market lines, often using weighted averages. For instance, the nfelo NFL model assigns 65% of its weight to market lines and 35% to its own projections.
Feature engineering is just as critical as the algorithm itself. Professionals create custom variables like "matchup deltas" or "Offensive Sigma", which measure how far a team's performance deviates from league averages. One automated NFL model that incorporated advanced metrics such as DVOA (Defense-adjusted Value Over Average) and EPA (Expected Points Added) achieved a 4% improvement in R² accuracy compared to models relying solely on basic box score stats. By transforming raw data into actionable insights, these models have become the cornerstone of professional betting strategies.
And now, thanks to emerging platforms, even everyday bettors can access these cutting-edge tools.
Using WagerProof for Pro-Level Data

WagerProof makes professional-grade tools available to anyone - no coding or advanced statistical knowledge required. The platform offers:
- Edge Finder: Analyzes data across multiple predictive models simultaneously to identify betting opportunities.
- AI Game Simulator: Uses Monte Carlo simulations to project the most likely distribution of outcomes.
- WagerBot Chat: Provides instant, data-driven answers to specific historical scenarios.
WagerProof also automatically flags outliers by comparing lines from various sportsbooks, helping users spot discrepancies relative to the market consensus. This kind of accessibility empowers everyday bettors to make more informed decisions using the same advanced methods as the pros.
Combining Historical Data with Real-Time Information
Why Both Historical and Real-Time Data Matter
Historical data sets the stage for what to expect in a game, but real-time information shows you what’s actually happening - and that’s where the real advantage lies.
Professional bettors know that pre-game analysis has a limited lifespan. As the game progresses, the reliability of historical data begins to fade. Unexpected events like a star player injuring their ankle during warmups, sudden weather changes, or shifts in a team’s rotation can quickly alter win probabilities. These real-time changes often outpace sportsbooks’ ability to adjust their lines, creating fleeting opportunities to find value. Historical baselines are important, but they must adapt to real-time developments.
The trick is identifying which signals matter most. This builds on the earlier focus on situational awareness, now applied to live betting. Not every event during a game is significant - missed shots or turnovers might just be noise. However, major events like red cards, key injuries, or service breaks demand immediate attention. Skilled bettors use a weighted approach: they rely on historical baselines but adjust based on how quickly a sport’s dynamics change. In slower-paced sports like soccer, the baseline holds longer unless a pivotal event occurs. In contrast, fast-paced sports like basketball require constant recalibration as the clock ticks.
"The most sophisticated bettors understand that a pre-game prediction is simply the first chapter of a story that unfolds in real time." - The Wager Theorem
This hybrid strategy - using automated tools for quick data analysis alongside manual validation for context - is what sets consistent winners apart. It’s not just about reacting to what happened minutes ago; it’s about blending that with months or years of historical trends to determine whether the current scenario offers genuine value or is just random noise.
Example: Finding Value Bets
Let’s break this down with an example. During a March 2024 college basketball tournament game, traditional models predicted the favorite would cover the spread based on season-long efficiency stats. But a calibrated model that combined historical tournament data with real-time market activity spotted unusual line movement, suggesting sharp money was backing the underdog. A bettor using this integrated approach could have identified the underdog as a value play, exploiting the market’s inefficiency.
Tools like WagerProof’s Edge Finder make this process seamless. It compares real-time market data from multiple sportsbooks against historical predictive models, flagging when the gap between your calculated probability (a mix of historical and live data) and the sportsbook’s implied probability is large enough to signal value. The AI Game Simulator runs thousands of scenarios using up-to-the-minute stats, while WagerBot Chat answers specific questions - like "How does this team perform in rain?" - with instant, data-driven insights.
The formula that pros rely on is simple:
New Price = (Weight_PreGame * PreGame_Price) + (Weight_InPlay * Market_Live_Price).
This method ensures bets reflect both long-term trends and real-time game dynamics. For example, if a team that usually shoots 38% from three-point range misses its first eight attempts, it suggests a likely regression to the mean. If the line hasn’t adjusted, this could present a clear opportunity. In moments like these, combining historical shooting percentages with real-time game flow becomes essential for spotting value.
Conclusion
Main Strategies Recap
Professional bettors don’t leave things to chance or gut feelings - they rely on systematic analysis of historical data paired with real-time insights. The strategies outlined here all focus on one goal: transforming raw data into meaningful, actionable decisions.
Trend analysis allows you to identify recurring patterns, such as a coach’s adjustments after losses, a team’s performance under specific weather conditions, or seasonal trends that show when teams perform at their peak or decline. Situational analysis digs deeper, examining factors like travel schedules, rest days, and even referee tendencies - details often overlooked by casual bettors. Then there’s value betting, which involves calculating your own probabilities based on historical metrics and comparing them to sportsbook odds. This approach helps you spot mispriced lines where the true likelihood of an outcome is higher than what the market suggests.
Data-driven strategies consistently outperform instinct-based approaches across key metrics, including ROI and loss reduction. These aren’t minor improvements - they’re the difference between merely breaking even and growing a sustainable bankroll. By combining historical patterns with real-time game dynamics, you can identify mispriced bets more consistently.
Getting Started with Data-Driven Betting
What separates casual bettors from professionals isn’t talent - it’s discipline, a focus on data, and the right tools. Start by focusing on one sport you understand well and tracking every wager. Log details like the date, amount, odds, reasoning, and outcome to uncover patterns in your strengths and weaknesses.
Tools like WagerProof make this process easier by offering professional-grade features. The Edge Finder scans real-time market data and compares it to multiple predictive models, flagging opportunities where your calculated probabilities highlight value. The AI Game Simulator runs thousands of game scenarios using up-to-date stats, while WagerBot Chat provides instant, data-backed answers to your betting questions.
Stick to disciplined betting habits. Allocate 80% of your bankroll to data-supported wagers and 20% to calculated risks. To avoid emotional decisions, enforce a 30-minute cooling-off period after any win or loss. Remember, the break-even win rate at most sportsbooks is 52.4%. Data-driven strategies give you the edge to consistently surpass that benchmark.
FAQs
How do professional bettors find value in sports betting?
Professional bettors excel at spotting opportunities by comparing the true probability of an outcome to the odds offered by sportsbooks. When they find that the implied odds are lower than their calculated probabilities, they identify a value bet - a wager with a positive expected value (+EV).
To do this effectively, they use tools like statistical models, historical data analysis, and real-time updates to pinpoint market inefficiencies. By studying trends, backtesting strategies, and keeping a close eye on market shifts, they fine-tune their decisions and steer clear of emotional betting. This disciplined method allows them to uncover opportunities that casual bettors often overlook.
How do real-time updates enhance betting strategies?
Staying updated in real time is a game-changer for refining betting strategies. It gives bettors access to the most current insights, helping them make quicker, more informed decisions. For example, following live shifts in betting lines - like reverse line movement (RLM) - can reveal where sharp money is influencing the market, potentially uncovering valuable betting opportunities. Beyond that, real-time stats on player performance, team dynamics, and game momentum allow bettors to adjust their wagers as the action unfolds, seizing opportunities as they arise.
Platforms such as WagerProof simplify this process by delivering real-time alerts and advanced tools that help identify unusual patterns or inefficiencies in the market. With these updates, bettors can stay ahead of odds changes and fine-tune their strategies for better outcomes over time. In the fast-moving world of sports betting, using real-time data is essential for staying competitive and making smarter plays.
Why is calibration more important than accuracy in sports betting models?
In sports betting, calibration holds greater importance than sheer accuracy because it ensures that predicted probabilities align with actual outcomes. This means a well-calibrated model gives you a more reliable picture of how likely an event is to occur, enabling smarter and more confident betting choices.
Take this example: if a model predicts a 70% chance of a team winning, proper calibration ensures that, over time, the team wins approximately 70% of the time. This alignment helps you manage risk better and spot value bets, paving the way for steadier profitability in the long run.
Related Blog Posts
Ready to bet smarter?
WagerProof uses real data and advanced analytics to help you make informed betting decisions. Get access to professional-grade predictions for NFL, College Football, and more.
Get Started Free