How Sharps Create Value by Exploiting Inefficiencies
Sharp bettors use data, math, and discipline to find mistakes in sportsbook odds, turning sports betting into a calculated strategy rather than a gamble. They focus on bets with a higher probability of success than the odds suggest, aiming for consistent, long-term profits. Key strategies include:
- Spotting pricing errors: These occur when odds don't reflect true probabilities, often due to public bias or overreactions.
- Targeting smaller markets: Niche leagues have more errors due to less attention and lower betting volumes.
- Using sharp signals: Metrics like reverse line movement (RLM), steam moves, and closing line value (CLV) help identify profitable bets.
- Avoiding public bias: Betting against popular trends often reveals overlooked opportunities.
Even casual bettors can apply these methods by analyzing odds movements, focusing on smaller markets, and using tools like WagerProof to track sharp activity in real time. The goal is simple: find value and bet smarter.
Sports Betting Markets Are NOT Efficient - Here's Why (Explained)
What Are Market Inefficiencies in Sports Betting?
A market inefficiency is essentially a pricing error - it happens when the odds set by a sportsbook don't align with the actual mathematical probability of an event. These discrepancies create what experienced bettors, or sharps, call "value." In simple terms, if the true probability of a team winning is 55%, but the odds suggest only a 50% chance, that gap becomes your advantage.
Why do these mistakes happen? Sportsbooks aren't flawless. They rely on statistical models, public betting trends, and their own risk management strategies - all of which have their limitations. One major factor is public bias. Popular teams like the Dallas Cowboys or Manchester United tend to attract heavy betting from casual fans. To balance their risk, sportsbooks adjust the lines, often inflating the favorite's odds and unintentionally creating value on the underdog.
Another source of inefficiencies is information asymmetry. If you're quick to act on late-breaking news - like an injury update, weather changes, or a team's travel struggles - before the sportsbook adjusts its odds, you gain a temporary edge. Similarly, recency bias can skew the lines. Both oddsmakers and the public sometimes overreact to a team's most recent performance, leading to exaggerated shifts after a big win or loss.
Now, let’s take a closer look at what drives these inefficiencies.
What Causes Market Inefficiencies
Not all betting markets are created equal. Major leagues like the NFL or Premier League tend to be highly efficient. Why? The sheer volume of bets and participation by sharp bettors forces the odds to become more accurate over time. In fact, opening lines in these leagues show a 98.5% correlation to closing lines. But smaller or niche markets are a different story. For instance, Finland's Veikkausliiga has only an 85% correlation, making pricing errors more frequent and longer-lasting.
Liquidity plays a big role here. Major leagues can see global betting volumes exceeding $100 million per match, while smaller leagues might not even hit $500,000. Since sportsbooks dedicate fewer resources to these smaller markets, their odds are often "softer", with wider profit margins - 6.0–8.5% compared to 2.5–4.0% in major leagues.
Another factor? Algorithmic blind spots. Statistical models often fail to account for qualitative elements like team morale after a tough loss, extreme weather conditions, or the fatigue caused by extensive travel - factors that are particularly relevant in geographically large countries like Brazil.
Real Examples of Betting Market Inefficiencies
Consider how these inefficiencies play out in real markets. In the Premier League, information spreads rapidly, and odds adjust almost instantly. But in Japan's J2 League, where the draw rate hovers around 30% per season, sportsbooks are slower to react. Similarly, Finland's Veikkausliiga sees home teams winning over 45% of matches - a higher rate than many major European leagues - but this trend is often underpriced by bookmakers.
Another common inefficiency arises from liability management. If a sportsbook receives overwhelming bets on one side, like the Los Angeles Lakers to win, they may shorten those odds to attract action on the other side. This adjustment has nothing to do with the actual win probability, creating value on the underdog. Sharps are quick to spot and exploit these opportunities before the lines stabilize.
These examples highlight how sharp bettors take advantage of inefficiencies, ultimately pushing markets toward greater accuracy over time.
How Sharps Exploit Market Inefficiencies
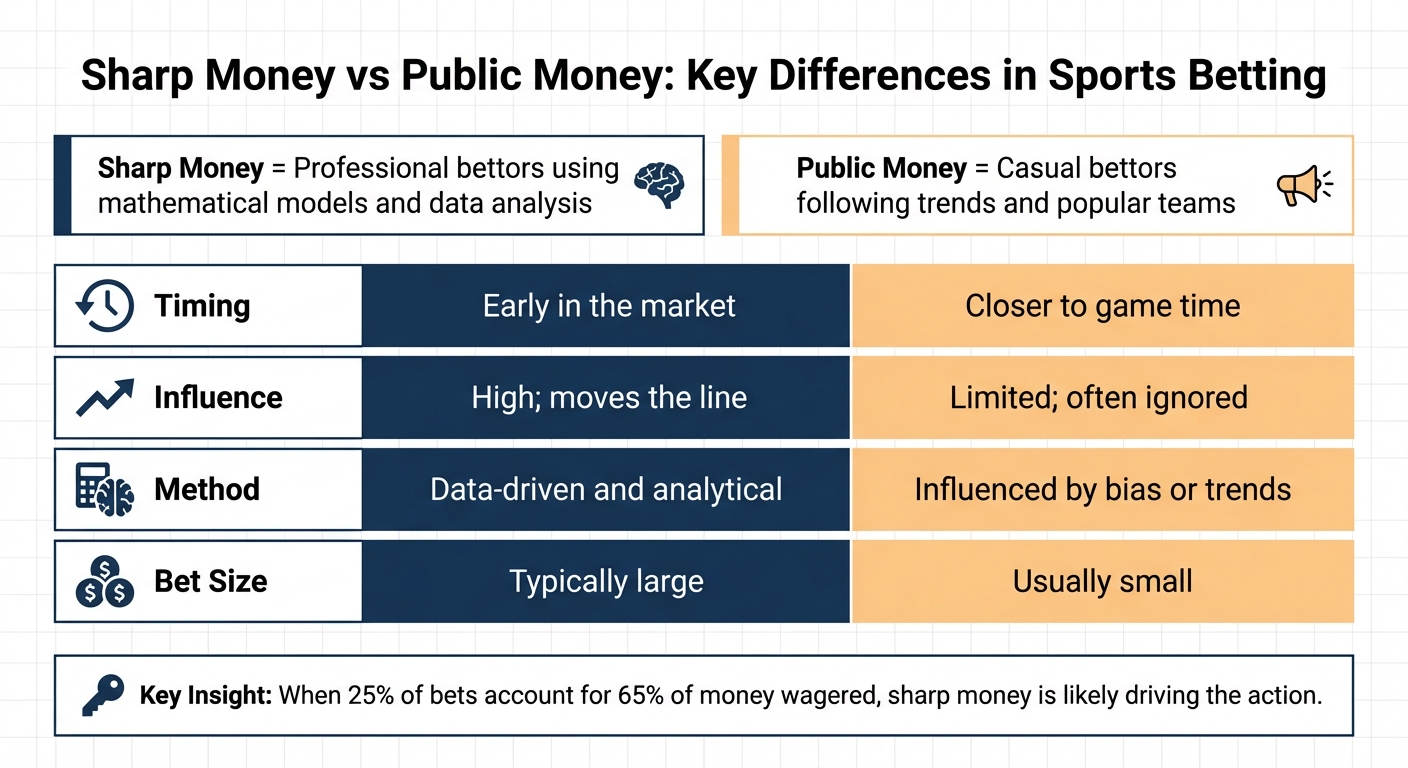
Sharp Money vs Public Money: Key Differences in Sports Betting
Sharps ignore gut feelings and instead rely on systematic, data-driven methods to exploit mispriced lines before sportsbooks have a chance to adjust. What sets them apart isn’t the size of their bankroll but their disciplined and analytical approach to finding mathematical edges.
Using Data Analysis to Spot Pricing Errors
Sharp bettors calculate the difference between a team’s true probability of winning and the odds offered by sportsbooks. They use a straightforward formula:
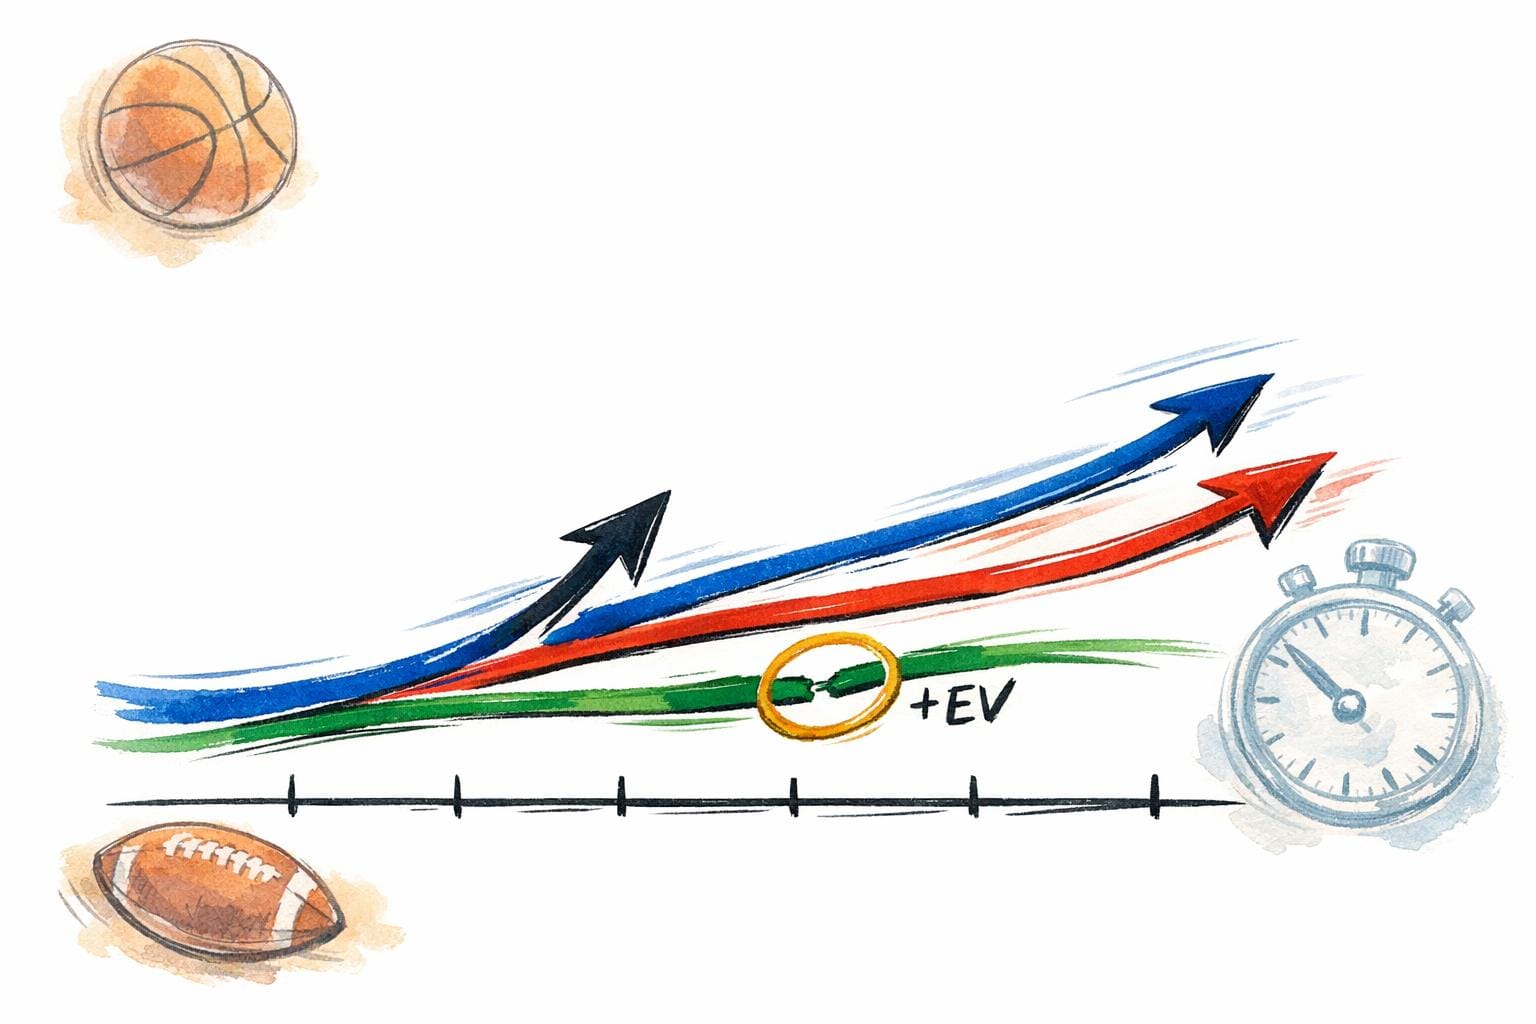
Value = (True Probability × Decimal Odds) – 1
If the result is greater than 0, it indicates a positive expected value (+EV). For instance, if a model predicts a team's chances of winning at 60%, but the sportsbook's odds imply only a 52% probability, that 8% gap highlights a betting opportunity.
Another key metric is Closing Line Value (CLV). Let’s say you place a bet at –2.5, and the line closes at –4. This means you’ve captured value. However, waiting until the line reaches –4 often erases any edge. Similarly, tracking discrepancies between the number of bets (tickets) and the total money wagered (handle) can reveal where sharp money is going. For example, if only 25% of bets are on an underdog, but that side accounts for 65% of the money, it’s a strong signal that sharps are backing the underdog.
| Feature | Sharp Money | Public Money |
|---|---|---|
| Timing | Early in the market | Closer to game time |
| Influence | High; moves the line | Limited; often ignored |
| Method | Data-driven and analytical | Influenced by bias or trends |
| Bet Size | Typically large | Usually small |
Once sharps identify an edge, they carefully monitor market changes, such as reverse line movement, to confirm their bets.
Following Reverse Line Movement
Reverse Line Movement (RLM) happens when the betting line shifts in the opposite direction of public betting percentages. For example, if 80% of bets are on the favorite but the line moves to make the favorite cheaper, it suggests sportsbooks are adjusting to sharp money rather than public action.
"The sportsbook respects the sharp's information... The bookmaker uses sharp money as a price-discovery mechanism to sharpen their own lines."
- Edgeslip
Sharps can distinguish between meaningful RLM and ordinary fluctuations by focusing on market-making sportsbooks like Pinnacle or Circa, which cater to professional bettors and set the "true price" for games. Some advanced bettors even use tactics like "head fakes", placing small early bets to shift the line before placing larger, strategic wagers. Because of this, verifying RLM with multiple data points is critical.
In addition to RLM, another sharp betting signal to watch is the phenomenon known as steam moves.
Capitalizing on Steam Moves
Similar to RLM, steam moves are a clear sign of sharp action. A steam move occurs when there’s a rapid, uniform shift in betting lines across multiple sportsbooks, triggered by large wagers from respected bettors or syndicates.
"A steam move is one of the clearest and most reliable indicators of concerted professional action."
- Andrew Thompson, Managing Editor, WinCastBetting
When sharps detect a steam move, they act quickly. Once the line adjusts, the edge that existed is usually gone, and betting the new number often results in negative CLV. Many sharps use automated tools to spot steam moves in real time, allowing them to place bets before all sportsbooks update their odds.
The difference between sharp and public money becomes especially obvious during steam moves. While public money leads to gradual, predictable line shifts closer to game time, sharp money causes sudden, decisive changes early in the market. This coordinated action highlights the sharp bettor's ability to extract value systematically, setting them apart from casual players.
Tools for Tracking Sharp Money and Market Inefficiencies
Tracking sharp money effectively hinges on having access to timely and accurate data. Historically, sharp bettors have relied on high-limit, market-making sportsbooks such as Pinnacle and Circa. These sportsbooks are known for reflecting the "true price" of games, as their odds are shaped by sharp action rather than retail betting patterns. Key data points to watch include:
- Ticket-versus-handle splits: When a small percentage of bets accounts for a large percentage of the money wagered.
- Reverse line movement: A situation where the line shifts against the majority of public bets at market-making sportsbooks.
- Steam moves: Sudden, coordinated changes in odds across multiple sportsbooks, often signaling sharp action.
For casual bettors, manually monitoring these signals across dozens of games is nearly impossible. That’s why specialized tools that consolidate and analyze this data in real time are essential.
How WagerProof Identifies Value Opportunities
WagerProof takes the complexity out of tracking sharp money by transforming raw data into actionable insights. The platform gathers professional betting data and presents it in a clear, user-friendly interface. By comparing prediction market spreads, analyzing public betting percentages against money movement, and identifying outliers, WagerProof flags games with potential value.
The platform also offers WagerBot Chat, which connects directly to live data. This tool integrates weather updates, injury reports, odds changes, and statistical models into a single, cohesive analysis. Bettors can simply ask questions in plain English and receive real-time, data-driven recommendations - no guesswork involved.
WagerProof’s AI research agents take things a step further. These agents continuously analyze sports matchups and generate betting picks based on customizable parameters like risk tolerance, preferred sports, and betting style. Unlike traditional pick services that operate behind a veil of secrecy, WagerProof makes all agent results and methodologies public, allowing users to verify their accuracy before acting on them.
Why Data Transparency Matters
Transparency is a critical factor when evaluating sharp betting tools. For instance, not all line movements are created equal. Some reflect genuine sharp action at market-making books, while others are simply the result of public risk management strategies at retail sportsbooks like DraftKings or FanDuel. Without clear data transparency, it’s impossible to differentiate between the two.
WagerProof addresses this by clearly disclosing the sources of its data and how its recommendations are formed. This empowers bettors to validate insights by cross-referencing multiple data points, confirming movements at market-making sportsbooks, and tracking closing line value over time. By providing this clarity, WagerProof helps users develop the skills to identify value independently, rather than relying on opaque services.
How Casual Bettors Can Use Sharp Betting Methods
Sharps excel at exploiting market inefficiencies, but even casual bettors can adopt some of their strategies. By focusing on key signals and using the right tools, you can start betting with a sharper edge. The secret lies in understanding the metrics that matter most and applying them consistently.
Finding and Fading Public Bias
One of the simplest ways to think like a sharp is by identifying and betting against extreme public bias. When the majority of bets - 70% or more - favor one side, it often signals a chance to take a contrarian position. For instance, between 2005 and 2013, NFL underdogs receiving 20% or less of spread bets posted a 57.7% win rate against the spread. Home underdogs in the same situation performed even better, with a 59.4% win rate.
"The collective bias of public bettors can create inefficiencies in the betting market, presenting opportunities for sharp bettors who rely on data and analysis rather than public sentiment."
- Sabrina Wang, InPlayLive
A recent example from September 2023 highlights this principle. Over 90% of public bets on Colorado pushed the spread against Oregon from -17 to -21. Oregon dominated the game, winning 42-6, which aligned with sharp action.
To confirm sharp activity, look beyond public sentiment and analyze the numbers. A gap between the Money % and the Ticket % can signal sharp action - specifically, when the Money % is at least 10% higher than the Ticket %. Once you spot these patterns, you can use basic data analysis to evaluate the potential value.
Starting with Basic Data Analysis
You don’t need advanced models to identify value bets. Start by focusing on three reliable metrics: ticket-versus-handle ratios, reverse line movement, and closing line value (CLV). These are the same tools sharps rely on, and they’re accessible through most modern betting platforms.
For example, if 70% or more of bets favor one team but the betting line shifts to benefit the opposing side, it’s a strong indicator that sportsbooks are reacting to sharp money. Tracking these shifts can help you identify opportunities.
CLV is another critical metric. If you consistently place bets at better odds than the final closing line, you’re on the right track, even if individual game results vary. Remember, to break even on standard -110 odds, you need to win at least 52.38% of your bets. Professional bettors aim for around 57%, and tracking your CLV over time can show whether you’re beating the market.
Once you’re comfortable with these metrics, tools like AI can help streamline your decision-making process.
Using WagerProof's AI Tools for Better Betting Decisions
Platforms like WagerProof simplify sharp betting by consolidating essential data into one place. Their Edge Finder tool uses over 50 statistical models and z-scores to highlight value bets. A z-score above 2.0, for example, suggests a strong consensus that a line offers value.
The WagerBot Chat feature makes real-time betting decisions easier by combining live data - such as weather updates, injury reports, and odds - into actionable recommendations. Instead of jumping between multiple sites, you can ask questions and get detailed, step-by-step analysis.
WagerProof also tracks Public Money Splits, showing where ticket percentages diverge from money percentages. This insight acts as a guide to sharp action.
Another standout feature is WagerProof’s AI research agents, which analyze matchups and generate picks tailored to your betting style and risk tolerance. For example, an NBA study on the platform demonstrated that using models calibrated for probability led to an average ROI of +34.69%, while focusing solely on accuracy resulted in a –35.17% ROI. Plus, all agent results are fully transparent, so you can verify their performance before relying on their recommendations.
Conclusion: What You Need to Know About Exploiting Market Inefficiencies
Market inefficiencies happen when sportsbook odds fail to align with the actual likelihood of an outcome. These gaps often stem from factors like public bias, how bookmakers manage their liabilities, and information disparities - especially in lesser-known or niche markets. These smaller markets, with lower liquidity, tend to magnify such inefficiencies.
Sharp bettors approach this differently than the average bettor. They rely on mathematical models to calculate fair odds and identify pricing errors. Their strategies include monitoring reverse line movement, taking advantage of steam moves, and prioritizing closing line value over short-term wins. The critical distinction lies in their focus on expected value (EV) and probability, while public bettors often lean on emotion or recent trends.
You don’t need to be a professional to adopt some of these methods. For instance, casual bettors can start by spotting reverse line movement - cases where over 70% of bets favor one side, yet the line shifts in the opposite direction. Exploring niche markets, like Japan’s J2 League or Finland’s Veikkausliiga, where oddsmakers may lack expertise, can also uncover opportunities. Keep in mind that to break even on standard wagers, you need to win about 52.38% of your bets.
In today’s data-driven world, tools like WagerProof are making it easier for casual bettors to compete. These platforms combine professional-grade betting data - such as prediction markets, historical stats, public betting trends, money lean, and statistical models - with real-time updates. Features like WagerBot Chat provide live odds, weather updates, and injury reports, delivering actionable insights without the guesswork. Meanwhile, AI research agents analyze matchups around the clock, offering full transparency so users can verify performance.
The key to exploiting market inefficiencies isn’t just about picking winners - it’s about consistently identifying value. By leveraging data and focusing on long-term valuation, you can maintain an edge that sets you apart from the crowd.
FAQs
How do I tell if a bet is +EV?
To spot a +EV (positive expected value) bet, you need to compare your calculated probability of an outcome to the bookmaker's implied probability. If your estimated probability is higher, that suggests the bet could offer value.
Here's the formula to calculate expected value:
EV = (Probability × Win Amount) - [(1 - Probability) × Bet Amount]
If the result is positive, the bet qualifies as +EV, meaning it has the potential to be profitable in the long run.
What’s the fastest way to confirm reverse line movement is real?
To identify reverse line movement (RLM), you need to monitor line changes alongside public betting data. Specifically, focus on situations where the line shifts in the opposite direction of where the majority of public money is being bet. This often indicates that sharp money - bets placed by knowledgeable or professional bettors - is impacting the market.
Using tools like Ticket % and Money % in real time can make this process easier. Automated platforms, such as WagerProof, are particularly useful for spotting these discrepancies quickly. They help verify whether the line movement is tied to significant, respected wagers rather than casual public betting patterns.
How can I use CLV to know if my strategy works?
CLV, or Closing Line Value, is a handy way to gauge how well your strategy is performing. Essentially, it measures how often you secure better odds compared to the market’s closing price. If you’re consistently landing positive CLV, it’s a strong sign that you’re spotting value and taking advantage of market inefficiencies.
It’s worth keeping an eye on your CLV over time. Why? Because it’s actually a more reliable indicator of profitability than just looking at your win-loss record. For a fuller understanding of how well your strategy is working, combine CLV with other metrics like ROI and win rate. Together, they paint a much clearer picture.
Related Blog Posts
Ready to bet smarter?
WagerProof uses real data and advanced analytics to help you make informed betting decisions. Get access to professional-grade predictions for NFL, College Football, and more.
Get Started Free