How to Read Public Betting Splits
Public betting splits help you understand how bets and money are distributed across a betting market. By analyzing two key metrics - Ticket Percentage (Bet %) and Handle Percentage (Money %) - you can identify trends, market inefficiencies, and even sharp money (professional bets). Here's a quick breakdown:
- Ticket %: Shows the number of individual bets placed on each side. High percentages often reflect public sentiment.
- Money %: Tracks the total dollars wagered. Large gaps between Ticket % and Money % often signal sharp action (fewer bets, larger amounts).
Key Insight: When the Money % is at least 10% higher than the Ticket %, professionals may be backing that side. Look for reverse line movement (lines shifting against public bets) to confirm sharp activity.
Sportsbooks adjust lines based on these splits, so understanding them can help you spot opportunities before the market corrects. Tools like WagerProof simplify this process by flagging sharp money indicators and line movements in real time.
Understanding the Two Main Metrics
Bet Percentage (Tickets)
Bet percentage measures the number of individual bets placed on each side of a wager. For example, if 100 people bet on a game and 70 choose Team A while 30 choose Team B, the bet percentage would be split 70% to 30%. This metric gives insight into public sentiment, showing which side the majority of bettors favor.
Most of these bets come from recreational bettors. When a team garners 65% or more of the tickets, it’s generally seen as a strong public preference. This often happens with popular teams or heavy favorites that casual bettors tend to back.
Handle Percentage (Money)
Handle percentage, on the other hand, tracks the total dollar amount wagered on each side, regardless of how many individual bets are placed. A few large bets can significantly sway the handle percentage, even if the bet count is heavily tilted in the other direction.
This metric reflects the dollar-weighted stance of the market, often revealing where professional or high-stakes bettors are focusing their money. For instance, if a team has a low ticket percentage but a high handle percentage, it suggests that fewer bettors are placing much larger wagers - an indicator of sharp money.
In a hypothetical game between the Dallas Cowboys and Carolina Panthers, the Cowboys received 82% of the public tickets, but the Panthers attracted 54% of the total handle. This contrast suggests that while the majority of casual bettors favored the Cowboys, a smaller group of high-stakes bettors placed larger wagers on the Panthers, signaling sharp action.
These two metrics - bet percentage and handle percentage - work together to highlight potential sharp activity and provide valuable clues for identifying market movements.
How to Identify Sharp Money
Large Gaps Between Tickets and Handle
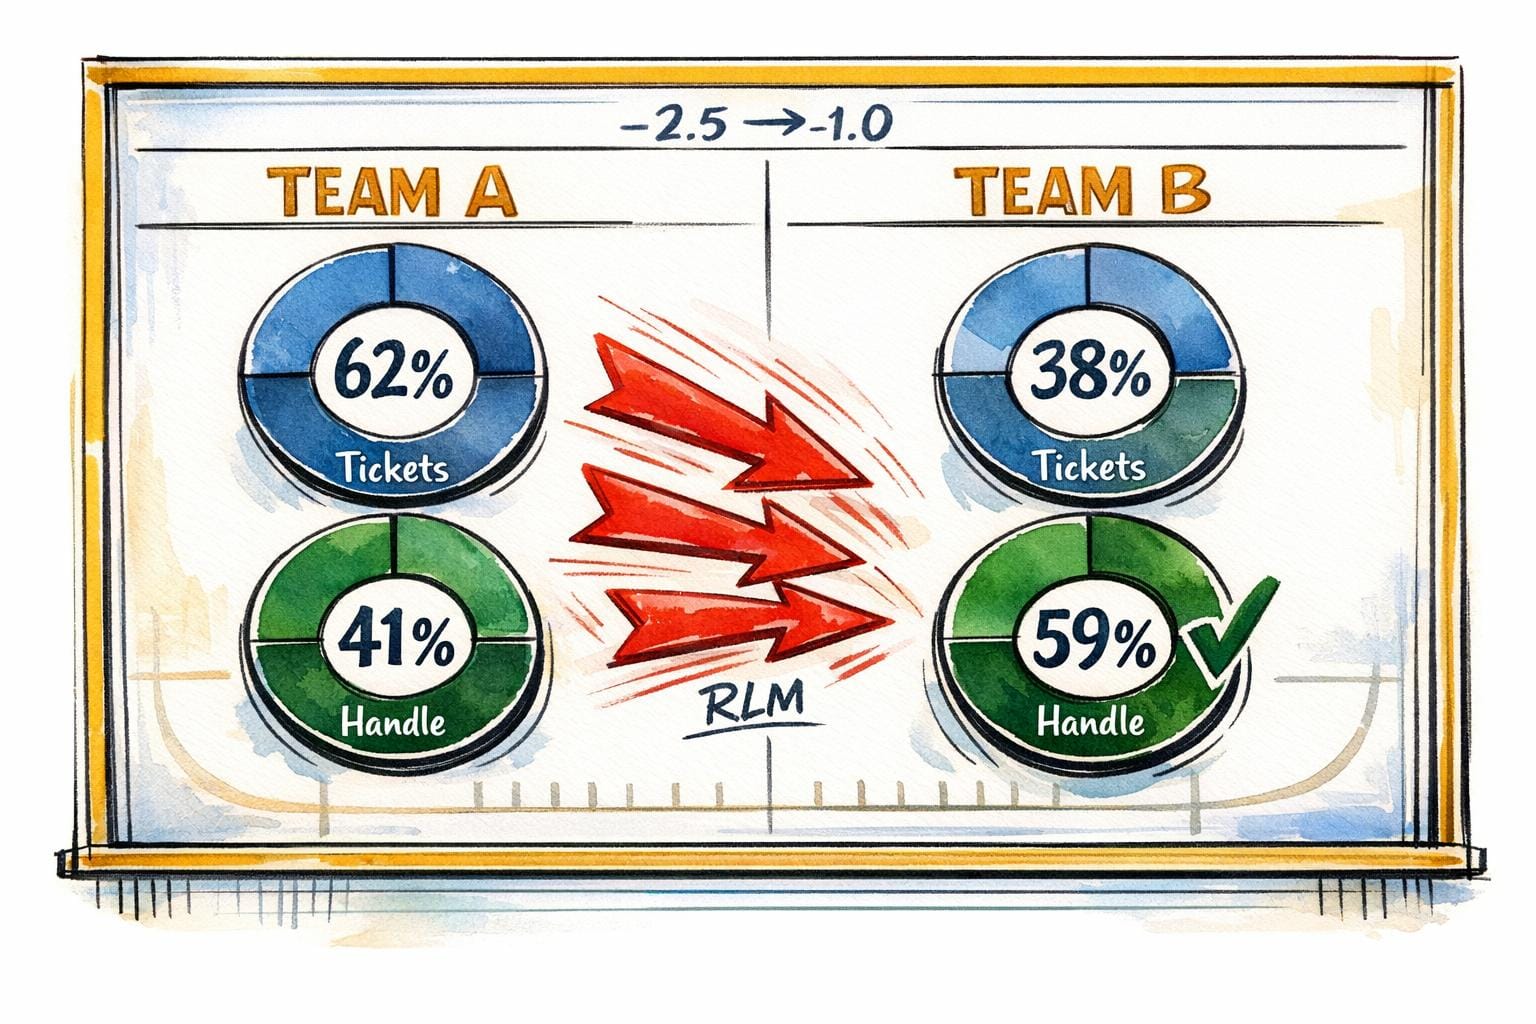
One of the clearest signs of sharp money is spotting a large gap between ticket and handle percentages. If a team has a smaller percentage of tickets but a noticeably larger share of the total money, it’s a strong clue that professional bettors are involved.
The magic number to watch for is a 10% or greater gap. For instance, imagine a team pulls in 35% of the tickets but accounts for 50% of the money. That’s a 15-point difference - a sign that fewer bettors are placing significantly larger wagers on that side. These high-stakes bets often come from sharp bettors, who rely on detailed analysis and larger bankrolls to make their plays.
To spot this, simply subtract the ticket percentage from the money percentage. If the result is +10% or more, you’re likely seeing sharp money in action. This method is especially useful when applied to real betting situations.
Real-World Examples
Take the New York Jets as an example. In one instance, they were underdogs who received 42% of the total bets but accounted for 51% of the overall money. This gap indicated that while fewer people were betting on the Jets, those who did were wagering much larger sums. This kind of alignment between high-dollar betting and a specific side is a hallmark of sharp money. It’s a perfect case of professional bettors influencing the handle percentage far beyond what public betting trends would suggest.
Betting Splits: Which Should You Trust More?
Reading Line Movement with Betting Splits
Understanding how betting splits influence line movement is key to identifying professional betting activity. Let’s dive into how these shifts occur and what they reveal.
When Line Movement Matches Sharp Money
When line movement aligns with sharp betting activity, it’s a clear sign of professional involvement. One common example is reverse line movement (RLM) - this happens when the line shifts in the opposite direction of where the majority of public bets are placed. For instance, if 75% of bets favor a team at -6 but the line moves to -4.5, sharp money is likely driving that change.
Another indicator is market resistance. Even when a large majority, say 80%, of bets are on one side, the line staying firm suggests sharp bettors are backing the other side. Sportsbooks are cautious about moving lines off key football numbers like 3 or 7 unless there’s heavy sharp pressure, so pay close attention when RLM approaches these critical points.
Then there are steam moves, which represent some of the strongest sharp action. These happen when multiple sportsbooks adjust their lines simultaneously in response to significant bets from respected syndicates. Such moves show that books are reacting quickly to limit their exposure to sharp wagers.
By recognizing these patterns, you can better anticipate how lines will shift and why.
Predicting Future Line Changes
Betting splits not only reveal sharp money but also help predict upcoming line adjustments. For example, if only 20% of bets are on a team but they account for 50% of the money, sharp bettors are likely opposing the public, and the line is expected to move in their favor.
Timing is everything. Early-week lines tend to be softer, making them more susceptible to sharp action, while late-week adjustments often reflect final sharp-driven corrections. Public bettors tend to overreact to breaking news, like a star player’s injury, leading to exaggerated line swings. Sharp bettors, on the other hand, often take advantage of this by “buying on bad news” when the market has overreacted. If you notice this pattern in the splits data, it’s a strong signal that a late-line reversal could be on the horizon as professionals capitalize on public overreaction.
Step-by-Step Analysis Process
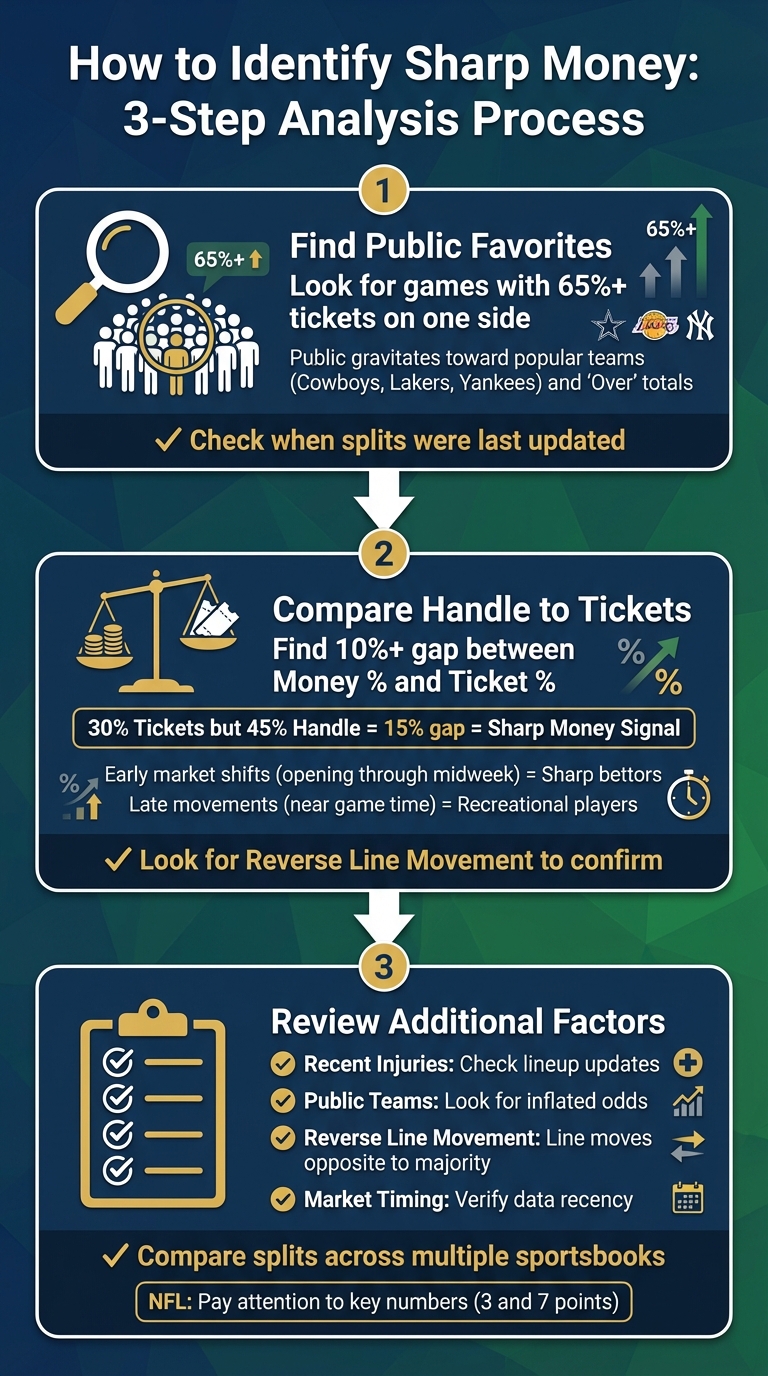
3-Step Process to Identify Sharp Money in Sports Betting
This workflow will help you identify games where sharp money presents potential value. Using the insights shared earlier, follow these steps to transform splits data into actionable betting strategies.
Step 1: Find Public Favorites
Begin by spotting games where 65% or more of tickets are on one side - this is a reliable indicator of strong public sentiment. The public often gravitates toward popular teams like the Cowboys, Lakers, or Yankees and tends to favor the "Over" in totals markets. Make sure to check when the splits were last updated, as outdated data can lead to inaccurate conclusions.
Step 2: Compare Handle to Tickets
Next, focus on identifying the contrarian side (with 35% or fewer tickets) and see if its handle exceeds its ticket share by at least 10%. For example, if a team has only 30% of the tickets but accounts for 45% of the handle, that 15-point difference could indicate sharp money at play. Look for verification through reverse line movement. Early market shifts - typically from the opening lines through midweek - are often driven by sharp bettors, while late movements closer to game time are usually influenced by recreational players.
Step 3: Review Additional Factors
Double-check the splits against current news to ensure they reflect the latest conditions. A skewed split might be reasonable if, for instance, a star player is ruled out or if extreme weather is expected. Compare splits across multiple sportsbooks to see if the trend is consistent across the market or unique to one platform's audience. In NFL games, pay close attention to key numbers - line movements around 3 or 7 points are more meaningful than smaller adjustments, as they often signal sharp involvement.
| Factor | What to Look For | Why It Matters |
|---|---|---|
| Recent Injuries | Check for injury or lineup updates | Previous splits might no longer be valid if key players are unavailable |
| Public Teams | Heavy betting on popular teams (e.g., Cowboys, Lakers, Yankees) | Odds may be inflated, creating potential value on the underdog |
| Reverse Line Movement | Line moves opposite to majority ticket action | Suggests sharp money is countering public betting trends |
| Market Timing | Verify how recent the splits data is | Early sharp action is more reliable, while late moves often reflect casual bets |
Using WagerProof for Splits Analysis

WagerProof simplifies the way you analyze betting splits by offering real-time tools all in one place. Instead of jumping between multiple sites, you get everything - betting splits, prediction markets, statistical models, and historical trends - on a single, easy-to-use platform.
One standout feature is the Edge Finder, which takes the hassle out of spotting market inefficiencies. For example, when there's a 10% or greater gap between money percentage and ticket percentage - a strong indicator of sharp money - the Public Money Splits tool flags it instantly. No need to manually calculate these differences; WagerProof does it for you.
The platform also keeps you updated with automated alerts for reverse line movement, while the Model Aggregator identifies games with a Z-score above 2.0, signaling potential betting opportunities. To back up these insights, the AI Game Simulator compares win probabilities with implied odds, helping confirm if a sharp money indicator points to a profitable bet. Unlike pick services that simply hand you recommendations, WagerProof explains why a bet might hold value, teaching you to identify patterns on your own.
For additional support, you can consult WagerBot Chat, which taps into live professional data to answer your questions about splits analysis. Whether you're at home or on the go, WagerProof works seamlessly on web, iOS, and Android, ensuring you never miss an alert or opportunity.
Conclusion
Understanding public betting splits helps distinguish casual betting trends from where professional bettors are putting their money. By comparing Ticket % and Money %, you can spot sharp action - where larger sums are being wagered. This analytical approach reduces bias and uncovers market inefficiencies, such as Reverse Line Movement, before they vanish.
Josh Applebaum, a writer at Casino.org, emphasizes: "If you consistently use the same thresholds, confirm the context behind the numbers, and only bet when the current price still makes sense by your own criteria, splits can sharpen your process." Splits should act as a starting point for research - not a definitive signal. Always cross-check with external factors like injury updates to ensure you're analyzing the most accurate market conditions.
Achieving long-term success means developing a repeatable, objective strategy. Instead of chasing narratives, focus on identifying moments when public overreaction inflates lines. These instances often provide opportunities for contrarian value. Transitioning from impulsive bets to a systematic approach is what sets apart casual bettors from those who consistently uncover edges.
This method not only helps you spot market inefficiencies but also equips you to make smarter bets. Tools like WagerProof simplify this process by flagging key gaps between money and ticket percentages, offering real-time alerts for Reverse Line Movement, and identifying value bets through the Edge Finder. With access to professional-grade data, transparent tools, and insights into why a bet has value, WagerProof ensures you make informed, data-driven decisions - not blind guesses.
FAQs
How often do betting splits update?
Betting splits are updated frequently - often in real-time - particularly during live betting. This constant updating ensures you’re always looking at the most up-to-date information on both bet counts and money percentages, giving you a clear picture of the latest market activity.
Why can the handle % disagree with the ticket %?
The handle % represents the total amount of money wagered, while the ticket % reflects the number of individual bets placed. Differences between these two figures often happen because larger bets - usually made by sharp or professional bettors - can significantly impact the handle %, even if the number of bets on that side is smaller.
How can I confirm sharp money beyond splits?
To spot sharp money, look for noticeable differences between the percentage of bets placed and the total money wagered - typically a gap of 10% or more. Also, keep an eye on reverse line movement and live betting data, as these can reveal where sharp action is influencing the market. Tools like WagerProof are useful for tracking these trends and providing insights to identify sharp activity with greater accuracy.
Related Blog Posts
Ready to bet smarter?
WagerProof uses real data and advanced analytics to help you make informed betting decisions. Get access to professional-grade predictions for NFL, College Football, and more.
Get Started Free