
Key Data Sources for Niche Sports Betting Models
Niche sports betting offers opportunities in less-covered markets like table tennis, surfing, or lower-tier soccer leagues. These markets are often less optimized by bookmakers, presenting inefficiencies that bettors can exploit. To succeed, you need reliable data from three main sources:
- Official League Feeds: Provide schedules, rosters, standings, and live updates. Examples include Sportradar, which covers over 80 sports and 750,000+ events annually.
- Historical Data: Essential for backtesting and analyzing trends. Platforms like Betfair offer historical odds and match data for sports like tennis and soccer.
- Real-Time Odds: Track live betting lines, money flow, and market shifts to spot inefficiencies. WebSocket APIs deliver updates in milliseconds for accurate tracking.
Advanced tools like WagerProof streamline these data layers, offering features like automated edge detection, public betting trends, and AI-driven predictions. By combining accurate data, live updates, and market analysis, you can build models that identify profitable opportunities in niche sports.
Finding Edges Betting on Niche Sports | Circles Off Presented by Pinnacle Ep #164
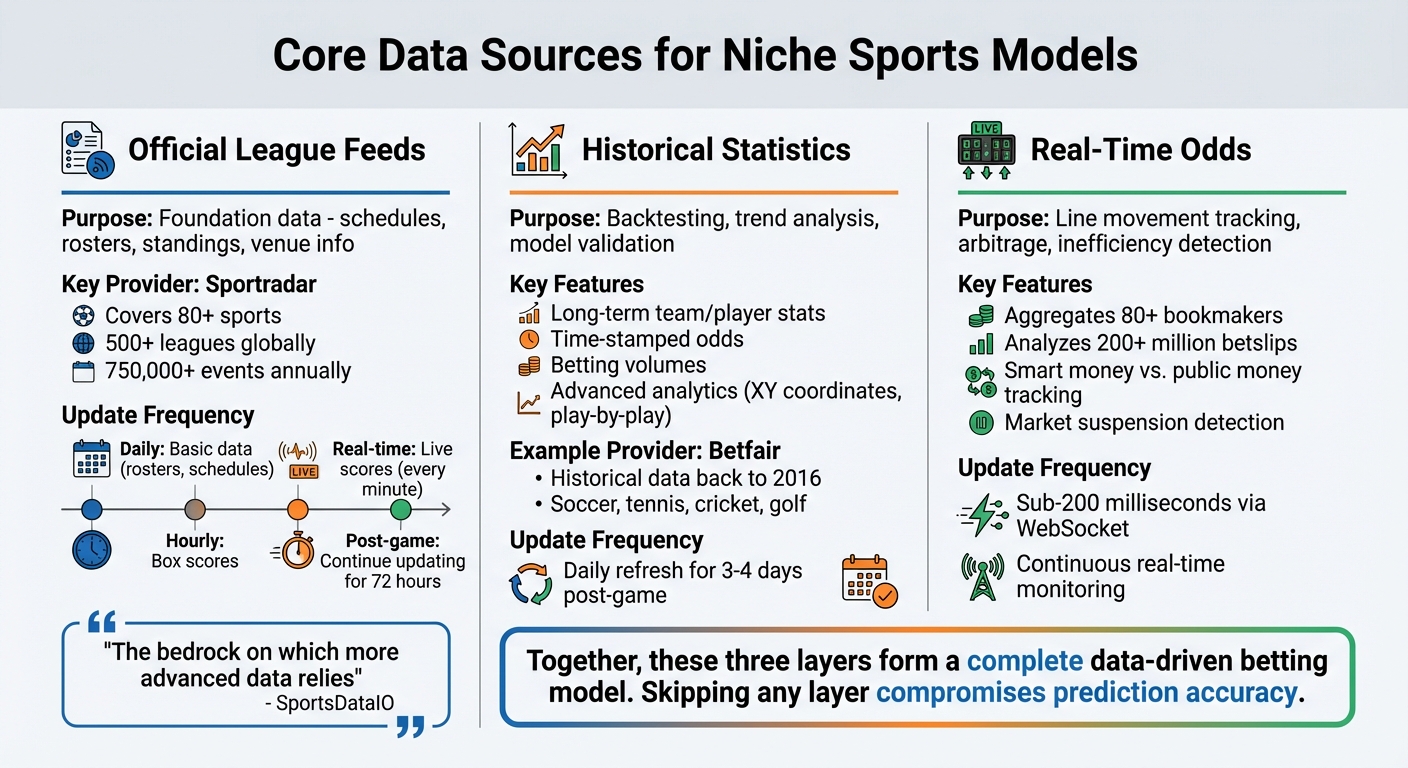
Core Data Sources for Niche Sports Models
Three Essential Data Sources for Niche Sports Betting Models
Building a reliable niche sports betting model requires integrating three key data layers. Skipping any of these compromises the accuracy of predictions and the effectiveness of betting strategies. Together, these layers form a structured approach to data-driven modeling.
Official League and Federation Data Feeds
The foundation of any robust model lies in official league and federation feeds, which provide essential details like schedules, standings, rosters, venue information, and league hierarchies. As SportsDataIO puts it, these feeds are "the bedrock on which more advanced data relies". Without precise roster data, interpreting box scores or player stats becomes nearly impossible.
For niche sports, these feeds often include specialized metrics that generic aggregators overlook. For example, Sportradar, a key provider, covers over 80 sports and 500+ leagues globally, managing data for more than 750,000 events annually. Their portfolio includes niche sports like Aussie Rules, Badminton, Darts, Futsal, MMA, Snooker, and Table Tennis. According to Sportradar:
"More than 65 leagues and federations across the globe trust us to give them the highest quality data at the fastest speeds".
To maintain accuracy, sync basic data like rosters and schedules once daily during off-peak hours. Box scores should be refreshed hourly, while live scores require real-time updates - every minute or via push notifications. Additionally, keep updating box score data for up to 72 hours post-game, as corrections (e.g., NFL stats) can occur days later. Using "Delta Box Scores" minimizes API calls and processing demands.
Historical Statistics and Performance Data
Historical data complements official feeds by offering a retrospective lens for backtesting and refining models. Long-term team and player statistics are vital for testing your strategies before investing real money. This data, combined with time-stamped odds and betting volumes, enables you to simulate strategies against past market behavior.
For instance, Betfair provides historical Stream API data for soccer, tennis, cricket, and golf dating back to 2016. Similarly, platforms like Balldontlie offer decades of game logs and statistics across 20+ leagues. Beyond the basics, historical archives can include advanced analytics like player tracking (with XY coordinates) and detailed play-by-play breakdowns, helping uncover patterns that basic stats might miss.
The ability to differentiate meaningful trends from random noise hinges on the depth and quality of historical data.
Real-Time Odds and Betting Market Data
Tracking live odds, public betting percentages, and money flows is crucial for identifying inefficiencies in niche markets. Aggregating data from over 80 bookmakers allows you to spot outliers - instances where certain sportsbooks lag in adjusting to new information.
Understanding the distinction between "smart money" (professional bettors) and "public money" (casual wagers) is another key factor. Some platforms analyze over 200 million betslips to identify professional betting patterns. For applications like arbitrage or live betting, prioritize APIs with WebSocket connections, as they deliver updates in under 200 milliseconds. Monitoring fields like "UnlistedTime" in data feeds can also help detect when sportsbooks suspend markets - often signaling significant events your model should account for.
| Data Type | Purpose | Update Frequency |
|---|---|---|
| Official League Feeds | Schedules, rosters, box scores, league structure | Daily (basic data); Hourly (stats); Real-time (live scores) |
| Historical Stats | Backtesting, trend analysis, model validation | Daily refresh for 3–4 days post-game |
| Real-Time Odds | Line movement tracking, arbitrage, sharp money detection | Sub-minute via WebSocket feeds |
Advanced Analytics and Sport-Specific Metrics
Adding advanced analytics to core data feeds can uncover insights that go beyond the surface of basic stats. Numbers like goals scored or total points often contain too much "noise" to reliably predict outcomes. Instead, technical indicators - like pass counts, ball possession rates, or shot distributions - tend to provide more useful predictive signals, especially when pre-game market expectations are already accounted for. These refined metrics work hand-in-hand with the dynamic insights provided by live feeds.
In-Play Tracking and Live Performance Feeds
Live tracking systems collect high-frequency event data and positional information (XY coordinates), offering an incredibly detailed view of the action. This level of detail allows for advanced metrics like "pitch control", which measures the space a team dominates at any given moment - providing a much deeper analysis than simple possession percentages.
Sportradar, for example, utilizes a network of 12,600 scouts to gather live data across 32 sports, covering over 900,000 events annually. Their tracking systems are precise, with measurement errors of less than three feet when recording player positions. To put this into perspective, a study of 50 soccer matches using this technology produced over 300 million data points. Even in niche sports, this depth of data collection is transformative. AI-driven systems now deliver real-time insights and odds for more than 100,000 table tennis matches each year.
For integrating live feeds into your model, opt for Server-Sent Events (SSE) over traditional polling to reduce latency. Additionally, normalize physical metrics - like comparing distances covered during possession versus out-of-possession - to ensure clarity. Remember, in-play data should enhance pre-game expectations; if it doesn't, it could introduce unnecessary noise. This level of granularity equips your model to better incorporate broader market trends.
Public Betting Trends and Market Behavior
Performance metrics tell one part of the story, but market behavior provides another critical layer. By tracking timestamped line movements, you can identify market halts or relistings, which often indicate volatility. Pay close attention to Closing Line Value (CLV) and calibration over hundreds of bets. If these metrics start to decline, it's time to revisit your data and mapping. However, if your model consistently finds edges that outperform the market's closing price, you’ve likely discovered a long-term advantage - even if short-term outcomes vary.
To refine your approach, combine market signals with sport-specific modeling. For example, low-scoring sports like soccer or hockey benefit from Poisson-style models, while high-scoring sports like basketball are better suited for team-rating models that use metrics like Offensive Rating (ORtg) and possessions. For sports with unique structures - such as golf, where "GroupKeys" link outcomes in head-to-head matchups - customize your data handling to align with the sport’s betting market.
Using WagerProof for Niche Sports Betting

Creating a betting model for niche sports can feel like assembling a complex puzzle. You often need to pull data from various sources - league feeds, historical stats, live tracking systems, and tools that analyze market behavior. WagerProof simplifies this process by bringing all these data streams together in one place. From prediction markets to public betting splits and statistical models, you can access everything instantly. This consolidated approach saves you the hassle of juggling multiple subscriptions and keeps your betting model development more efficient.
WagerProof's Data Platform
WagerProof integrates official feeds, historical stats, and live odds into a single, cohesive framework. This setup works seamlessly with the core and advanced data layers mentioned earlier. By combining real-time model calculations with market data, WagerProof helps quantify betting edges in spreads and totals. One standout feature is its ability to track "Sharp vs. Public" money flow with precise percentages. For instance, the platform might highlight a 73% vs. 27% split, showing where professional money is leaning. This kind of insight is especially useful in niche markets, where public sentiment often clashes with sharp analysis.
Another key feature is the platform's multi-model consensus approach. It aggregates predictions from various analytical methods, such as the EPA Composite Model and Advanced Metrics Model. When these models align on a single outcome, it signals a higher-confidence play. For example, WagerProof's AI Game Simulator might deliver a 67% confidence rating based on input from three different models. This cross-validated approach is invaluable in niche sports, where limited sample sizes can make single-model predictions less dependable.
Automated Outlier Detection and Value Signals
WagerProof takes its data integration a step further with automated tools for spotting value discrepancies. The Edge Finder tool compares your model's predictions with current market lines, flagging specific edges - like a 1.5-point spread advantage or a 2.7-point total edge. Instead of manually tracking line movements across multiple sportsbooks, the platform does the heavy lifting for you, continuously monitoring for mismatches.
The platform also identifies "Value Plays" and "Fade Alerts" by analyzing gaps between public betting percentages and model confidence levels. For example, it might flag a 37% discrepancy where public betting on a spread stands at 21%, but the model's confidence hits 58%. Similarly, it can uncover total outliers, such as a 30% gap between public betting on the over and the model's confidence in the under. These alerts are particularly helpful in niche sports, where mispriced lines are more common due to lower market liquidity.
"The trend analysis tools have helped me find edges I never knew existed. This platform is a game-changer!" - Priya K.
WagerBot Chat and Real-Time Insights
WagerProof enhances its analytical tools with WagerBot Chat, a personal betting assistant that connects directly to live model data. This feature explains lines, percentages, and the reasoning behind identified edges. Unlike generic chat tools, WagerBot relies on verified sports data and real-time odds to provide accurate insights without errors. Whether you're analyzing table tennis or lower-tier soccer, you can ask WagerBot why a particular line offers value.
"Our chat assistant uses the real live model data to explain any line, percentage, or rationale to you." - WagerProof
Data Validation and Model Accuracy Checklist
Reliable data is the backbone of effective betting models, as highlighted throughout this guide. When creating a betting model for niche sports, you’ll need to gather league stats, odds, and tracking data. Without proper validation, your predictions could fall apart. A structured process for cleaning, organizing, and testing your data ensures your model stays accurate and dependable.
Data Validation Steps
The first step is to standardize your data format across all sources. Ensure column names are consistent and convert scores and statistics into numeric values. This avoids issues where your model might attempt to calculate with text instead of numbers. Remove duplicates by using a unique identifier, like match_id, to ensure no event is counted more than once.
Rows missing critical information - such as game dates or final scores - should be dropped. For less important fields, like attendance at lower-tier matches, you can fill missing values with defaults (e.g., set attendance to 0). Use an alias dictionary to standardize team names so variations like "Man City" and "Manchester City" are treated as the same team.
Odds must also be consistent. Convert all odds into a decimal format for internal calculations, regardless of whether they’re provided as American or fractional odds. This makes comparisons between sportsbooks straightforward. Additionally, check the sanity of 2-way market probabilities - both outcomes should add up to around 1.0. If they don’t, either remove the event or re-normalize the probabilities to avoid skewed inputs.
Integration and Testing
After validating and harmonizing your data, the next step is integration and testing to confirm your model’s reliability. When combining data from different sources, avoid look-ahead bias by maintaining strict chronological separation. For example, don’t use season-long averages to predict early-season games if those averages include data from future matches. This common error can make backtests look great but fails during live betting.
Evaluate your model’s performance with meaningful metrics. Calibration checks whether your predicted probabilities align with actual outcomes. For instance, if your model predicts 70% confidence on 100 bets, about 70 of those bets should win. Sharpness, on the other hand, measures how confidently your model makes predictions. A model that consistently predicts 50/50 probabilities might be calibrated but won’t provide much betting value. By tracking both metrics, you can ensure your model is not only accurate but also effective at identifying edges in niche markets, where pricing errors are more likely.
Conclusion
Creating a successful niche sports betting model hinges on three key elements: reliable data, rigorous validation, and effective tools to uncover betting opportunities. Start by ensuring your data sources and validation processes are rock-solid. The difference between a profitable model and a losing one often comes down to the quality of your data and how thoroughly you test it. For in-play betting, official league feeds are essential - they provide the accuracy and speed needed to capitalize on fleeting opportunities, where even small timing gaps can turn a sharp line into a stale one.
Your model’s primary goal is to calculate true probabilities that outperform sportsbook odds. To achieve this, clean, standardized data is a must, along with strict chronological separation to avoid look-ahead bias. Focusing on niche markets, like NCAA prop bets or lower-tier leagues, can be especially rewarding since bookmakers often allocate fewer resources to perfecting those lines.
Combining validated data with advanced tools is equally important. Platforms like WagerProof bring together professional-grade data and automated tools to streamline your analysis. Their features - such as the Edge Finder, AI Game Simulator, and WagerBot Chat - are designed to highlight value bets and mispriced lines. WagerProof also offers a Free Plan for basic access and a Premium Plan for full AI tools and community support via Discord.
Accuracy and transparency should guide every step of your process. Use official data whenever possible, validate your inputs rigorously, and thoroughly test your model's calibration before committing real money. Niche markets often present lucrative opportunities for those who approach them with discipline and the right resources.
FAQs
What’s the minimum data I need to model a niche sport?
To create a model for a niche sport, you'll need a few key data sources: historical game results, player and team statistics, and betting odds data. It's crucial to gather odds from multiple sportsbooks to better evaluate probabilities and spot potential value bets. These elements are the backbone of crafting reliable models and making smarter decisions.
How do I avoid look-ahead bias when backtesting?
To steer clear of look-ahead bias, make sure your backtest relies solely on data that would have been available at the time of the event. For example, avoid using future data, such as season-long averages, if that information wasn’t accessible during the specific period you're analyzing.
To mimic real-world conditions, timestamp your data and confirm when it was actually released. This approach ensures that future information doesn’t distort your results, keeping your backtest aligned with realistic performance and avoiding overly favorable projections.
How fast do real-time odds updates need to be for live betting?
For live betting to be effective, real-time odds need to refresh frequently. For most in-play markets, updates every 40 to 60 seconds are ideal. However, for faster-paced events, odds should update every 20 to 40 seconds to keep up with the action. These timely updates allow bettors to make smarter, well-informed decisions during live games.
Related Blog Posts
Ready to bet smarter?
WagerProof uses real data and advanced analytics to help you make informed betting decisions. Get access to professional-grade predictions for NFL, College Football, and more.
Get Started Free