
10 Key Metrics Every Sports Bettor Should Track
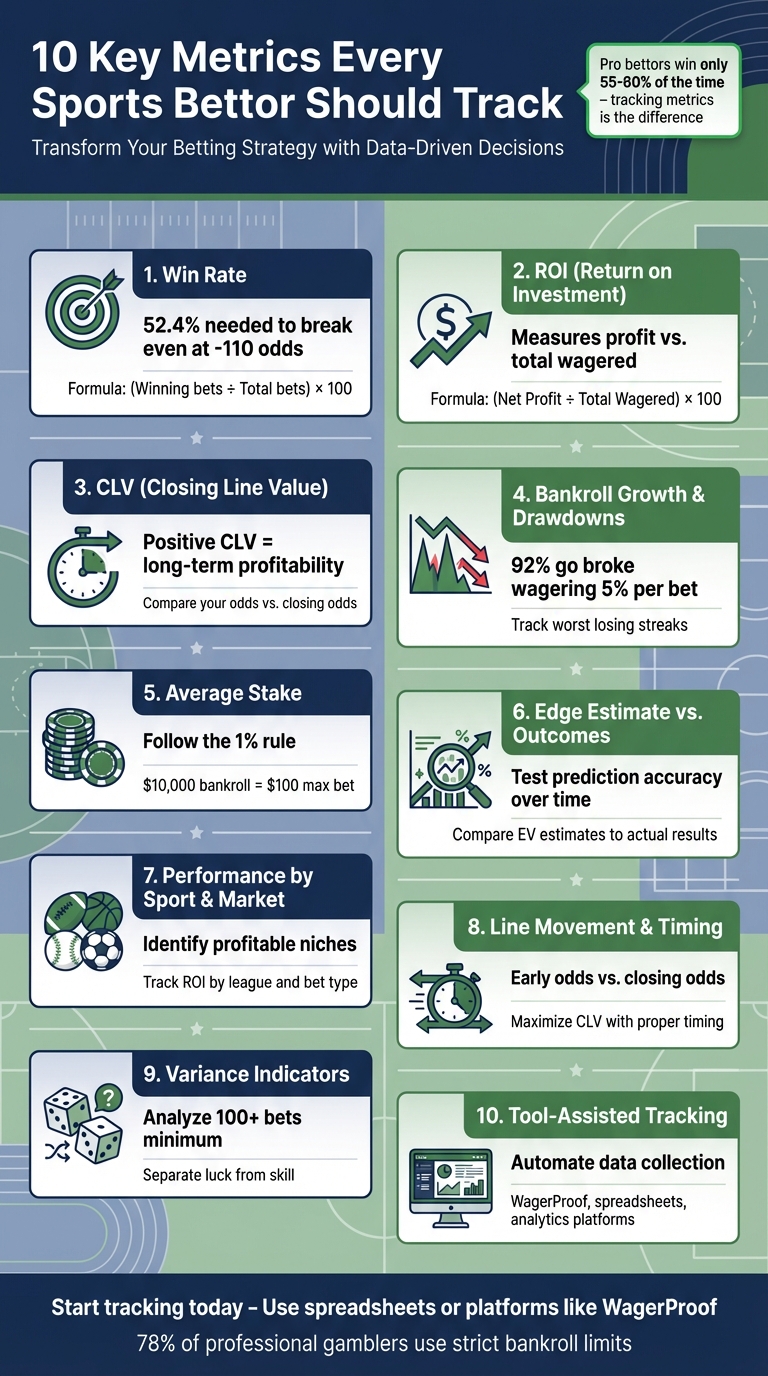
Most sports bettors lose money because they don't track the right data. Winning consistently isn't about luck - it's about using metrics like ROI, Closing Line Value (CLV), and bankroll management to make smarter decisions. Here's a quick breakdown of the 10 metrics that can transform your betting strategy:
- Win Rate: Measures how often your bets succeed. A 52.4% win rate is needed to break even on standard -110 odds.
- ROI (Return on Investment): Shows how much profit you make relative to the total amount wagered.
- CLV (Closing Line Value): Tracks whether your odds beat the market's final odds, a strong profitability indicator.
- Bankroll Growth & Drawdowns: Monitors your financial progress and largest losing streaks.
- Average Stake: Helps assess if you're betting consistently or making emotional decisions.
- Edge Estimate vs. Outcomes: Compares your predictions with actual results to refine your strategy.
- Performance by Sport & Market: Identifies which sports or bet types are profitable for you.
- Line Movement & Timing: Shows how betting at the right time impacts your odds.
- Variance Indicators: Differentiates between bad luck and flawed strategies.
- Tool-Assisted Tracking: Platforms like WagerProof simplify tracking and analysis for better insights.
Tracking these metrics helps you manage risk, find value, and improve long-term profitability. Even pros only win 55–60% of the time, so disciplined tracking and data analysis are key. Start with a spreadsheet or use tools to make the process easier.
10 Essential Sports Betting Metrics Every Bettor Should Track
How to Create an Excel Sports Betting Tracker Dashboard | Part 1
1. Win Rate and Sample Size
Win rate measures how often your bets are successful. To calculate it, divide the number of winning bets by the total number of bets, then multiply by 100 to express it as a percentage. For instance, if you place 50 bets and win 27, your win rate would be (27 ÷ 50) × 100 = 54%.
But here’s the catch: win rate alone doesn’t tell the full story of profitability. The odds tied to your bets play a crucial role. For example, with standard –110 odds, you need a win rate of 52.4% just to break even. So, even a high win rate means little if the odds aren’t in your favor.
Another key piece of the puzzle is sample size. A short streak - like winning 8 out of 10 bets - might look impressive but doesn’t provide a reliable picture. Variance, or natural swings in results, can mislead you. It might make a bad strategy seem effective or cause you to abandon a good one after a few losses. While analyzing 100 bets can give you a rough idea, professional bettors often review 300–500 bets to identify genuine performance trends and minimize the influence of luck.
The takeaway? You need enough data to separate skill from randomness. That’s why sample size is so important.
"Bookkeeping tells you what you're good at, what you're not good at, and everything in between. Most people who first jump into sports betting tend to believe they can easily beat the market, but tracking the data can take the emotion and irrational thinking out of it." – Brian DeFranco, The Hammer
Once you’ve gathered enough data, track your win rate across different sports, bet types, and strategies. Pair this analysis with profitability metrics like ROI for a more complete picture. Speaking of ROI, let’s dive into that next.
2. Return on Investment (ROI)
Building on the concept of win rate analysis, Return on Investment (ROI) measures how effectively your betting strategy turns wagers into profit. It’s calculated using the formula: ROI = (Net Profit / Total Wagered) × 100. This metric offers a straightforward way to evaluate the performance of your bets over time.
Unlike win rate, ROI provides a more complete perspective. For instance, consistently betting on favorites with low payouts might lead to losses despite a high win rate. On the flip side, betting on underdogs with fewer wins can still yield profits if the payouts are substantial.
Here’s an example to put this into perspective: imagine wagering a total of $1,000 across multiple bets and earning a profit of $200. Using the formula, your ROI would be ($200 / $1,000) × 100 = 20%. A positive ROI means you’re making money, whereas a negative ROI indicates losses.
"While many bettors focus on their win percentage, ROI gives a fuller picture by factoring in both the amount wagered and the payouts." – BettorEdge
To get the most out of ROI tracking, analyze it by bet type and league, especially over a sample of 100 or more bets. Reviewing monthly trends can help identify patterns and reduce the impact of short-term variance, revealing seasonal insights.
3. Closing Line Value (CLV)
Closing Line Value (CLV) measures the difference between the odds you locked in when placing your bet and the final odds available right before the game starts. It's a powerful indicator of long-term profitability because the closing line reflects the most efficient market price, incorporating all available information and betting activity. Alongside ROI and win rate, CLV helps confirm whether your bets exploit market inefficiencies.
Consistently achieving a positive CLV shows you're skilled at spotting undervalued bets before the market adjusts. For instance, if you place a bet at +150 (2.50 in decimal odds) and the closing odds are +130 (2.30), your CLV would be calculated as:
CLV = ((2.50 / 2.30) - 1) × 100 = 8.7%.
This positive CLV indicates you secured better odds than the market's final price, demonstrating an edge.
"A consistent positive CLV shows you're identifying value early." – BettorEdge
To track CLV effectively, calculate it for every bet using the formula above. Breaking it down by sport or bet type can uncover trends, such as consistently outperforming the closing line on NFL spreads but struggling with NBA totals. This type of analysis highlights where your strategy is working and where adjustments might be needed.
"Higher CLV often aligns with long-term profitability." – BettorEdge
Using analytics tools can simplify CLV tracking across different sports and bet types. When combined with metrics like ROI and win rate, CLV provides a more complete view of your betting performance. The ultimate goal is to maintain a positive CLV over a large sample of bets, while using insights from all three metrics to refine your overall strategy. Together, these metrics form a solid foundation for data-driven betting success.
4. Bankroll Growth and Drawdowns
Keeping track of your bankroll over time is a straightforward way to see if your betting strategy is working. Start by noting your initial balance, then update it after every bet to calculate your net profit or loss. This running log provides a clear picture of your financial progress and helps you spot trends over weekly, monthly, or even quarterly periods. But it’s not just about growth - understanding drawdowns is equally important.
Drawdowns are a measure of your worst losing streaks, showing how much your bankroll drops before bouncing back. For example, if your bankroll shrinks from $1,000 to $600, that’s a 40% drawdown. Spotting these patterns helps you evaluate whether your strategy might be too risky and prepares you mentally for the inevitable losses that come with betting.
A 2023 study revealed that bettors wagering 5% of their bankroll per bet went broke within six months 92% of the time. On the other hand, professionals who stick to the 1% rule manage to preserve their bankroll over the long term. For instance, with a $10,000 bankroll, keeping bets to $100 or less ensures you can weather losing streaks without significant damage. This conservative approach is a proven way to protect your funds and reduce the emotional toll of losses.
"It's not about winning all the time but surviving the losing streaks and staying in the game long enough to make the best of it. Responsible gambling starts with smart bankroll management." – Supriyo Khan
The numbers don’t lie - disciplined bankroll management is key to long-term success. It not only safeguards your capital but also helps you avoid emotional decisions during tough times. For example, poker professionals who take this cautious route report reducing losses from emotional betting, or "tilt", by over 65%. When you have confidence that your strategy can handle the ups and downs, you’re less likely to chase losses or make rash bets that worsen your situation. By tracking both your growth and your maximum drawdowns, you’ll have a complete view of your betting performance and financial health.
5. Average Stake and Risk Per Bet
Your average stake is a key indicator of how consistent you are with your betting strategy, as opposed to making emotionally driven decisions. To figure it out, simply add up all your stakes over a specific time frame - like a month - and divide that total by the number of bets you placed during that period. If your stakes vary wildly, it could mean you're chasing losses or getting overconfident.
A more precise way to evaluate your stake is by expressing it as a percentage of your bankroll. Many professional gamblers stick to the "1% rule", which means they never risk more than 1% of their total bankroll on a single bet. For example, with a bankroll of $10,000, you'd limit each wager to $100. This isn't just a random guideline - 78% of professional gamblers adhere to strict bankroll limits, with the 1% threshold being the most common.
"The 1% rule isn't arbitrary - it's rooted in probability and risk management. Professional gamblers understand that variance can wipe out even the most skilled players if they overextend."
– Supriyo Khan, SmileToTalk.com
Following disciplined stake sizing is crucial for protecting your bankroll during inevitable losing streaks. Research shows that risking more than 1% per bet significantly increases the chance of depleting your bankroll. For instance, ten consecutive losses at 1% per bet would only reduce a $10,000 bankroll by $1,000 - a manageable hit. But if you risk 5% per bet, those same ten losses would slash your bankroll nearly in half, leaving you in a tough spot.
As discussed earlier in bankroll growth strategies, proper stake sizing not only helps you avoid financial ruin but also ensures more stable long-term performance. Even the best professional sports bettors win only about 55–60% of the time, so losing streaks are inevitable. When your strategy accounts for these downswings, you're less likely to make impulsive, high-risk bets in an attempt to recover losses. For those looking to take their betting to the next level, the Kelly Criterion offers a method to optimize bet sizes based on your perceived edge. However, beginners are often better off sticking to fractional Kelly or flat betting.
6. Edge Estimate Versus Real Outcomes
To calculate your pre-bet edge, start with Expected Value (EV). This is the difference between your estimated true probability and the implied probability based on the sportsbook's odds. For instance, if the odds are –110 (implying a 52.4% probability) but your analysis suggests a 60% likelihood, the EV is positive. This indicates a potential undervalued opportunity .
Once you’ve placed bets, compare your pre-bet estimates with the actual outcomes. This step is crucial for testing the accuracy of your model over time. By tracking the differences between your predictions and the results, you can determine if your model reliably identifies edges or if it tends to overestimate. Regularly revisiting these comparisons creates a feedback loop that helps refine your approach.
A consistent positive gap between your predictions and the outcomes validates your edge. It shows that your pre-bet analysis is uncovering value that the market hasn’t fully accounted for.
"Winning in sports betting rarely comes from instinct or feel. It comes from data. The best strategies rely on identifying an edge through research, then building a plan with actionable insights." – PFF.com
This feedback loop is a cornerstone of effective model calibration. By continuously comparing your estimated probabilities with both market odds and actual results, you can identify any biases, update assumptions, and refine your focus on the most impactful factors . For example, if your NFL model consistently overemphasizes home-field advantage, the outcomes will reveal this flaw - giving you the chance to adjust before it affects your bankroll. Regularly updating your data to reflect changes like injuries, trades, or coaching shifts ensures your edge estimates stay relevant. This ongoing recalibration strengthens your strategy, aligning your pre-bet analysis with real-world performance.
7. Sport and Market Performance Split
Breaking down your results by sport, league, and bet type can uncover both profitable opportunities and areas where you're falling short. Just like with win rate and ROI, analyzing performance by market provides actionable insights. For example, tracking ROI separately for bet types like moneyline, spreads, totals, and props across various sports leagues helps you see which areas consistently generate profit and which ones might be draining your bankroll. If you notice spread bets in one league have a much higher ROI than totals in another, it’s a clear signal to focus your efforts where they pay off most.
This kind of detailed segmentation offers more clarity than just looking at your overall win rate. By isolating performance across major leagues - such as the NFL, NBA, MLB, and NCAA - you can pinpoint where you excel and where you struggle. Maybe you’re great at college basketball bets but find professional hockey more challenging. Without breaking things down this way, you might miss these patterns and continue investing in markets that aren't working for you.
Pay attention to how your bankroll grows by league and bet type to identify your strongest profit sources. For instance, if one type of bet is contributing far more to your profits than others, it might be time to reallocate your wagers to maximize returns. Tools with league-specific breakdowns and customizable filters can make it easier to spot these trends and act on them.
Regularly reviewing these splits helps you stay data-driven. If you notice consistent underperformance in a specific area - like underdog moneylines - you can adjust your strategy or stop placing those bets entirely. Combined with earlier metrics like ROI and CLV, this review process turns guesswork into informed decisions, giving you a sharper edge in your betting strategy.
8. Line Movement and Timing
Once you understand CLV (Closing Line Value), the next step is learning how to time your bets to make the most of line movements. Just like ROI and bankroll management, timing plays a crucial role in fine-tuning your betting strategy. By keeping an eye on how odds shift, you can decide whether to lock in early value or risk waiting and ending up with less favorable odds. Sportsbooks initially set their lines based on factors like team performance, injuries, historical data, and market trends. These lines aren’t static - they adjust in real time as the betting market reacts. Knowing how and when these changes occur can help you find the perfect moment to place your wager.
The timing of your bet can directly influence your potential profits. For example, if you lock in odds at +150 early on and the closing line shifts to +130, you’ve achieved a positive CLV. This ability to secure better initial odds is often a marker of long-term betting success.
However, real-time line shifts can happen fast, meaning you’ll need to act quickly to lock in favorable odds. In this fast-paced environment, hesitation can cost you. For instance, if a sportsbook offers a bet at –110 odds (representing a 52.4% implied probability) and your research shows the true probability is closer to 60%, you’ve identified a positive Expected Value opportunity. But here’s the catch: the market adjusts rapidly, and this edge could disappear before you know it.
Tracking how odds change from opening to closing lines can also reveal valuable timing patterns. Using analytics tools to monitor your personal CLV across different sports and bet types can help you refine your approach. If you consistently find yourself getting worse odds than the closing line, it’s a clear sign you need to adjust your strategy and look for better entry points for your wagers.
9. Variance Indicators and Luck
Variance refers to the natural ups and downs in betting results that happen regardless of skill level. In the short term, randomness can heavily influence outcomes, but over time, your actual edge becomes clear. The challenge is figuring out whether a losing streak is due to random fluctuations or a real problem with your strategy. Understanding variance works hand-in-hand with other metrics, helping you see how randomness impacts your overall results.
To measure variance, compare your expected outcomes with your actual returns. For instance, if you're consistently achieving positive CLV (Closing Line Value) but not seeing the profits you anticipated, the gap is likely caused by variance rather than a flaw in your approach. Even professional sports bettors, who average a win rate of just 55–60%, lose nearly half their bets. Knowing this can help you avoid giving up on a solid strategy during a tough losing streak.
Evaluating performance requires a large sample size - ideally 100 or more bets - to filter out short-term noise and get a clearer picture of true variance. A 2023 study found that bettors who risked 5% or more of their bankroll on each wager went broke within six months 92% of the time. This underscores how variance can devastate even skilled bettors who overextend themselves.
"Professional gamblers understand that variance can wipe out even the most skilled players if they overextend." - Supriyo Khan, Smile to Talk
To protect against these inevitable swings, many bettors follow the 1% rule - never wagering more than 1% of their bankroll on a single bet. This approach acts as a safety net during bad runs, ensuring your bankroll survives long enough for your edge to shine through over time. By focusing on long-term trends instead of reacting emotionally to individual wins and losses, you can maintain the discipline needed to succeed.
10. Tool-Assisted Edges with WagerProof
Tracking nine different metrics across multiple sportsbooks and bet types can feel like a full-time job. Thankfully, modern betting analytics platforms simplify this by consolidating your betting history and turning raw data into actionable insights - all without the hassle of spreadsheets or manual ROI calculations. These tools sync directly with your sportsbooks, cutting out tedious data entry and reducing errors. The result? You can spend less time crunching numbers and more time refining your strategy.
WagerProof takes this a step further with tools like Edge Finder, AI Game Simulator, and WagerBot Chat. The Edge Finder scans real-time stats and trends to uncover quantified betting opportunities, helping you spot value before placing a bet. Meanwhile, the AI Game Simulator runs thousands of scenario simulations using historical data and current matchups, providing probability-driven insights that go far beyond relying on instinct.
To help you visualize your performance, WagerProof offers intuitive dashboards that display key metrics like ROI trends, win/loss percentages, and profit/loss charts at a glance. It also breaks down your results by sport and market, making it easy to see which leagues or bet types are boosting your bankroll and which might be holding you back. The platform’s multi-model consensus approach combines insights from multiple predictive models, giving you a more reliable edge and greater confidence in your choices.
For parlay fans, the teaser optimization feature identifies combinations with real value. Plus, access to a private Discord community allows you to exchange insights with other data-driven bettors. With its transparent methodology - clearly showing how edges are calculated - WagerProof turns sports betting into a disciplined, data-driven process rather than a game of chance.
Conclusion
Tracking these 10 metrics transforms betting into a structured, data-driven process. Metrics like Win Rate and ROI tell you whether you're making a profit, while Closing Line Value helps confirm you're spotting mispriced odds before the market adjusts. Keeping an eye on Bankroll Growth and Drawdowns ensures your finances remain stable, and Average Stake reflects how well you're managing risk per bet. Breaking down performance by Sport and Market reveals where your strengths lie, and monitoring Line Movement and Variance Indicators helps separate skill from chance. Together, these metrics not only measure profitability but also shape smarter risk management.
For context, professional sports bettors usually maintain a win rate of just 55–60%, emphasizing the importance of disciplined risk management and finding value in the odds. Without a system to track these metrics, you're essentially navigating blind in a market where even small advantages can make a big difference.
To get started, a simple spreadsheet can do the trick. Log your bankroll, track your outcomes, and categorize results by sport and bet type to pinpoint which strategies are paying off. Keep an eye on your closing line value across markets, and stick to sound bankroll management principles, like wagering no more than 1% of your bankroll per bet, to weather inevitable losing streaks.
As your tracking evolves, platforms like WagerProof can simplify the process. These tools consolidate your data into user-friendly dashboards that showcase ROI trends, win/loss ratios, and profit/loss charts. Features like the Edge Finder and AI Game Simulator provide real-time, probability-based insights, using multi-model consensus to highlight opportunities. With clear methodologies behind these tools, you can focus on making more informed bets.
Start tracking these metrics now, review your results regularly, and refine your approach based on what the data tells you. Whether you prefer spreadsheets or advanced platforms like WagerProof, consistent tracking is the cornerstone of long-term betting success.
FAQs
What is Closing Line Value (CLV), and how can I calculate and improve it?
Closing Line Value (CLV) is a way to measure how the odds you bet on stack up against the closing odds - the final odds right before the event begins. It’s a crucial tool for assessing the quality of your bets and your ability to spot value in the betting market.
Here’s how you calculate it: CLV (%) = ((Your Odds / Closing Odds) - 1) × 100. For instance, if you placed a bet at odds of +150 and the closing odds were +120, your CLV would be positive, meaning you secured better value than the market did at closing.
Want to boost your CLV? Focus on these key steps:
- Spot value early by evaluating odds before the market has time to adjust.
- Track market movements to see how odds change and identify patterns.
- Fine-tune your approach by studying how market efficiency influences odds and adapting your betting strategy.
Consistently hitting positive CLV is a strong signal that you’re on the right track for long-term success in sports betting.
What is the 1% rule in sports betting bankroll management?
The 1% rule is a betting strategy that keeps your wagers at no more than 1% of your total bankroll. For instance, if you have $1,000 in your bankroll, the largest bet you’d place would be $10.
This method serves two purposes: it shields your funds during inevitable losing streaks and promotes disciplined, steady betting habits. By keeping risks in check, the 1% rule helps you preserve your bankroll and work toward more consistent outcomes over the long haul.
How do variance and sample size influence my sports betting results?
Variance represents the natural swings in betting results due to unpredictable short-term factors, like luck. These fluctuations can create winning or losing streaks that may not truly reflect the quality of your overall strategy.
When you analyze a larger sample size, these ups and downs tend to even out, providing more dependable insights into your performance. By concentrating on long-term patterns and resisting the urge to overreact to short-term outcomes, you can make smarter, data-focused decisions and fine-tune your betting approach with greater confidence.
Related Blog Posts
Ready to bet smarter?
WagerProof uses real data and advanced analytics to help you make informed betting decisions. Get access to professional-grade predictions for NFL, College Football, and more.
Get Started Free