Why Line Variance Matters in Betting Analytics
Line variance is the ongoing shift in betting odds or spreads from when markets open to game time, driven by factors like new information, public betting trends, and professional bettors' moves. Unlike Closing Line Value (CLV), which compares your locked-in odds to the final market odds, line variance captures these fluctuations and helps bettors identify the best moments to place wagers.
Key takeaways:
- Understanding market shifts: Timing bets during favorable odds changes can improve long-term profitability.
- Avoiding mistakes: Misinterpreting sharp money or overreacting to market noise can lead to poor decisions.
- Bankroll management: Adjusting bet sizes based on variance reduces risk during unpredictable swings.
- Tools for success: Platforms like WagerProof simplify tracking line variance, highlighting value bets and market inefficiencies.
How to Read Line Movement & Public Betting Percentage
Problems That Occur When You Ignore Line Variance
Understanding line variance is essential for making informed betting decisions. Overlooking its signals can lead to costly mistakes that undermine your strategy and bankroll.
Confusing Random Market Moves with Sharp Action
Failing to track variance can make it hard to distinguish between routine market fluctuations and genuine sharp action. Significant line moves are often driven by sharp money, confirmed injuries, or verified weather updates. On the other hand, routine fluctuations usually arise from unverified rumors, speculative forecasts, or minor changes that don’t cross critical numbers, such as 3 or 7 in football.
Sharp bettors often use tactics like "head fakes" to manipulate the market. For instance, they might place small bets early (when limits are low) to nudge the line in one direction, tricking casual bettors into thinking there’s professional action on that side. Once the limits increase, the sharp bettors place larger bets on the opposite side. Similarly, chasing "steam moves" - sudden shifts across multiple sportsbooks - can be a losing strategy. By the time you act, the value may already be gone.
Another crucial signal many bettors overlook is Reverse Line Movement (RLM). This occurs when the line moves against the majority of public bets. For example, if 70% of bets are on Team A but the line shifts to favor Team B, it’s a sign that professionals are heavily backing Team B. Ignoring the difference between ticket count (total number of bets) and handle (total money wagered) can cause you to miss these key insights. Misinterpreting these signals can lead to poor bet sizing during volatile market swings, compounding your losses.
Betting Too Much During Unpredictable Line Swings
One of the quickest ways to deplete your bankroll is by placing oversized bets during volatile market conditions. Overestimating your edge - even slightly - can lead to wagers that are 5–10 times larger than they should be. This aggressive approach can backfire, leaving you broke during a normal downswing before your long-term edge has a chance to materialize.
Even with an impressive 60% win rate, you’d still lose 40% of your bets. Statistically, there’s a 16% chance of being significantly down after just 100 bets, even with a 60% success rate. These cold streaks can take a psychological toll, often causing bettors to abandon sound strategies or panic by reducing bet sizes after losses. This reactive behavior makes it harder to recover when your edge eventually reappears. Poor bet sizing not only impacts short-term returns but also threatens the stability of your entire bankroll.
How Variance Affects Your Bankroll
Ignoring variance creates a gap between your expectations and actual outcomes. Even if you maintain a 52% edge - just above the break-even point of 52.38% at -110 odds - there’s still a 25% chance you’ll be in the red after 250 bets. That risk drops to 10% only after 1,000 bets.
"Even with positive EV and 100 bets, there's approximately a 30% chance you'll be behind... Variance is real and substantial, even for advantage bettors." - Joey Shackelford, Wizard of Odds
When the market moves against your position, it signals that your bet is becoming less likely to win. For example, if you place a bet at +148 odds and the line shifts to +162, the market is indicating a reduced probability of success. Recognizing these risks tied to variance is crucial for adjusting your betting strategy as conditions evolve. Without this awareness, you risk betting the same amounts regardless of whether the market is working for or against you, which can lead to unnecessary losses.
Using Line Variance to Find Betting Value
Line variance can be a powerful tool for uncovering market inefficiencies and spotting value before the broader betting audience catches on. Rather than avoiding variance, you can leverage it to identify profitable opportunities early, helping to safeguard and grow your bankroll.
Reading Large Line Moves and Professional Money
When you see a significant line shift, it’s often a sign that professional bettors, or "sharp money", have placed substantial wagers based on their analysis. The key is distinguishing this sharp action from routine market noise. Sharp money tends to trigger noticeable shifts early - often during quieter periods like weekday afternoons when casual bettors are less active.
For example, a bet-to-dollar ratio of 30% paired with 60% of the money wagered usually signals professional backing. Take NFL Week 12 in November 2024: the Green Bay Packers opened as -4.5-point favorites against the Minnesota Vikings. Despite 75% of public bets favoring the Packers, sharp money drove the line down to Packers -3, and the Vikings ended up covering.
Timing is critical. If you’re betting on favorites, it’s best to place your wagers early, before public money inflates the line. On the other hand, if you’re backing underdogs, waiting until closer to game time often works to your advantage. To identify sharp moves, rely on respected sportsbooks like Pinnacle or Circa as benchmarks. These sharp books often lead the way in setting lines, giving you a clearer picture of where discrepancies might lie.
Finding Value in Prediction Market Differences
Once you’ve identified sharp action, the next step is comparing prediction market spreads to sportsbook lines to uncover hidden value. Both sharp sportsbooks and prediction markets are excellent indicators of true probabilities because they rely on sophisticated models and high-limit wagers. When sportsbook odds deviate from prediction market prices, an opportunity for profit emerges. These gaps often occur because recreational books are slower to adjust, or because public betting has skewed the line away from its true value.
These discrepancies can reveal +EV (positive expected value) opportunities before the market corrects itself. For instance, the difference between prediction market spreads and sportsbook lines allows you to "buy low" or "sell high." Consider this: on no-vig peer-to-peer betting exchanges, about 40% of users are profitable, compared to just 2% on traditional sportsbooks. This is largely because exchange odds are more closely aligned with actual probabilities. By monitoring multiple sportsbooks, you can find "stale" lines - odds that haven’t yet adjusted to sharp market moves. Even a small half-point difference on key numbers like 3 or 7 in football can significantly impact your long-term returns.
Building Long-Term Profit Through Variance Tracking
The ultimate measure of your ability to use variance effectively is closing line value (CLV) - the difference between the odds you secured and the final closing line before the game starts. Consistently beating the closing line is a strong indicator that you’re identifying value before the market catches up.
"Winning the 'price battle' consistently is a far stronger predictor of success than a few lucky wins." - J. Jefferies, Core Sports Betting
Professional bettors aim to beat the closing line 60–70% of the time, but those who excel at analyzing line movement can push that rate to 75–80%. Here’s a telling example: betting on every NFL favorite since 2005 would have resulted in a 50% win rate and a loss of 78.5 units due to the vigorish. However, beating the closing line by just a half-point on those same bets would have increased the win rate to 52.9%, turning a significant loss into a profit.
Tracking your CLV across a large sample of bets is essential to verify your approach. If you’re consistently beating the closing line, it’s a strong sign that your variance tracking is converting market noise into long-term profit. However, avoid chasing steam moves after they’ve already occurred - by the time you act, the professionals have likely already capitalized on the opportunity.
How WagerProof Helps You Track and Use Line Variance
WagerProof takes the guesswork out of understanding line variance, turning market fluctuations into opportunities. Instead of spending hours manually tracking odds, WagerProof automates the process, monitoring real-time odds to uncover market inefficiencies and highlight value bets. With everything organized in one dashboard, you can focus on making smarter decisions while WagerProof handles the heavy lifting.
Automatic Value Detection with Edge Finder
WagerProof’s Edge Finder is designed to spot discrepancies between sharp market consensus and individual sportsbook lines. It calculates a theoretical "midpoint" probability - where both outcomes are equally likely - and compares it to the odds offered by various sportsbooks. This process flags significant mismatches. The tool also tracks key indicators like steam moves and reverse line movement to help you identify value early.
By using respected sportsbooks like Pinnacle and Circa as benchmarks, the Edge Finder pinpoints "lagging" lines at softer books - those that haven’t yet adjusted to sharp betting action. This gives you a chance to act on favorable odds before the market corrects itself.
Live Variance Analysis with WagerBot Chat
Building on the insights from Edge Finder, WagerBot Chat provides real-time analysis to enhance your understanding of market trends. Unlike generic AI tools that might provide outdated or inaccurate information, WagerBot uses live odds and prediction markets to deliver up-to-the-minute insights.
You can ask WagerBot questions like why a line moved from -3.5 to -5 within an hour, whether the shift indicates sharp action or public overreaction, and if the current odds still hold value. It also identifies late moves as sportsbooks adjust their limits before a game starts. Additionally, WagerBot flags deceptive early moves, known as head fakes, so you can avoid being misled.
"By learning to interpret line movement, you can gain a significant edge over others who blindly place +EV bets without considering where the market is headed." - Chris Tashjian, Outlier Pro
Using Historical Line Data to Spot Patterns
WagerProof also offers a historical line database that helps you analyze past odds movements in similar scenarios. The Line Expectancy tool shows when both outcomes were equally likely at any given time. Meanwhile, the Line Breakdown feature displays a market’s odds over time using color-coded bars to illustrate market balance.
This historical data helps you differentiate between sharp moves (sudden, dramatic changes) and public moves (gradual shifts). You can uncover patterns, like lines consistently moving toward a specific team before tipoff, which might indicate predictable sharp betting or programmatic sportsbook adjustments. By comparing your entry price to the historical closing line, you can measure your Closing Line Value (CLV) - a key metric for long-term profitability. Most professional bettors beat the closing line 60-70% of the time, but WagerProof’s tools can help push that rate to 75-80%.
Adding Line Variance to Your Betting Approach
High-Variance vs Low-Variance Betting: Risk and Return Comparison
Building on our earlier discussion about the challenges of variance, let’s explore how to incorporate line variance into your betting strategy. By adjusting your approach to reflect uncertainty - tweaking bet sizes, combining variance data with models, and separating high-risk from low-risk opportunities - you can refine your overall betting plan.
Adjusting Bet Sizes Based on Variance
Understanding variance allows you to fine-tune your bet sizes to better match the level of risk. For example, you might allocate 2%–3% of your bankroll to low-variance bets (favorites with odds between -200 and -150). On the other hand, for high-variance parlays with odds of +300 or higher, you’d scale back to just 0.25%–0.5% of your bankroll.
Many professional bettors prefer using fractional Kelly instead of full Kelly to avoid extreme fluctuations. Fractional Kelly (e.g., half or quarter Kelly) reduces volatility and provides a buffer against errors in probability estimates. If you’re placing multiple bets at once, you can further adjust by dividing your Kelly fraction by the square root of the number of active bets.
To stay consistent, cap each individual wager at 2%–3% of your bankroll. Regularly reassess and adjust your unit sizes - either weekly or monthly - as your bankroll grows or shrinks.
Combining Variance with Statistical Models
Integrating variance data with statistical models can help sharpen your betting edge. For instance, when your model identifies a +EV (positive expected value) bet and line movement suggests sharp money is backing it, you can confidently increase your wager size.
Take this example from 2024: a bettor analyzed the Cardinals vs. White Sox Over 4.5 runs. They found a 1.73% edge at MGM (-105 odds), while sharp books like Pinnacle had the line at -118. Line movement charts revealed the odds dropping from +105 to -105 across multiple sharp books, signaling professional action. In this scenario, the bettor increased their wager to 1.25 or 1.5 units.
Keep an eye out for reverse line movement (RLM) - when the line shifts in the opposite direction of public betting volume. This often indicates professional money is influencing the odds and can confirm your model’s findings. However, avoid chasing steam (betting solely because of a sharp line move). By the time you notice the shift, sportsbooks may have already adjusted the odds, erasing any value.
For bets placed well in advance of game time (more than six hours), set a higher edge threshold. Only place these bets if your edge is 8% or greater to account for the increased uncertainty that comes with time.
Comparing High-Variance and Low-Variance Bets
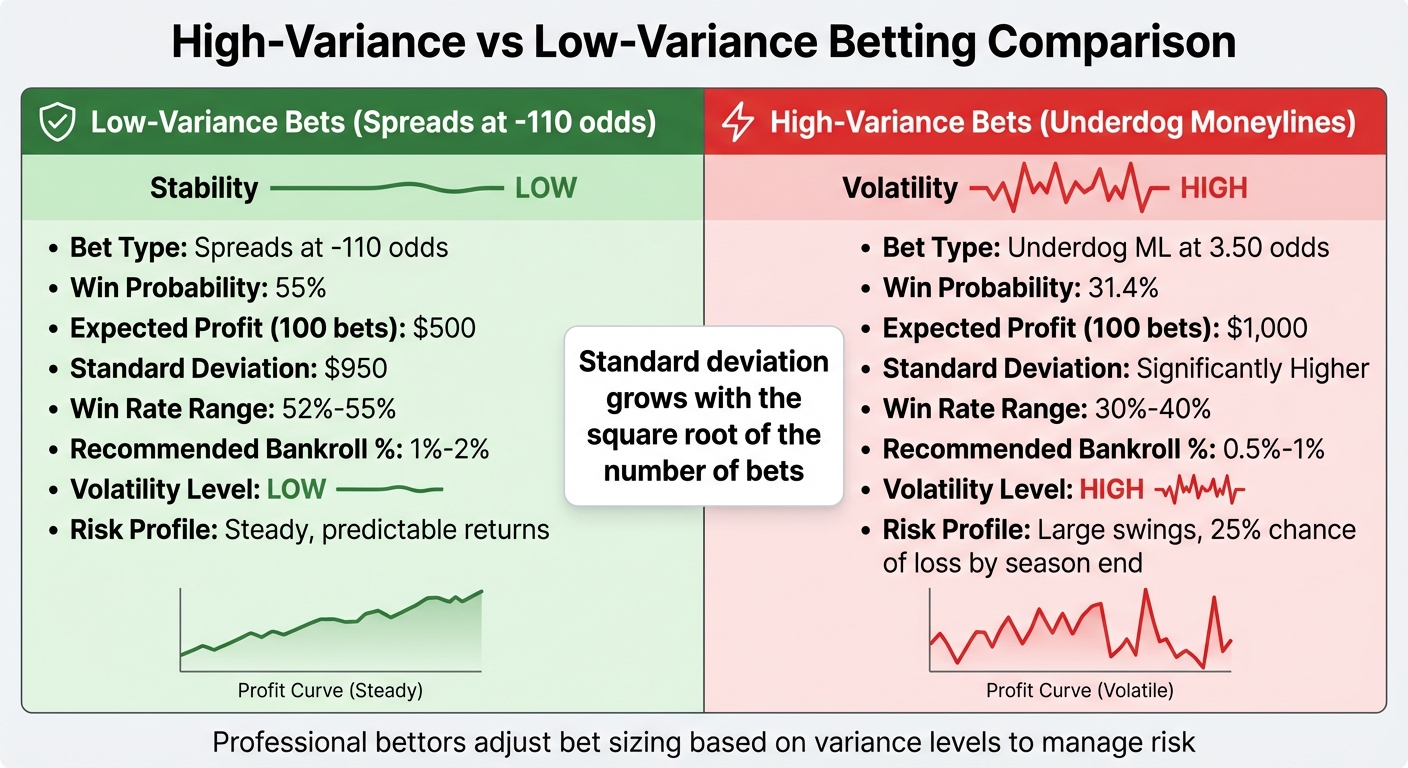
The contrast between high-variance and low-variance bets becomes clear when you look at large sample sizes. Low-variance bets, such as spreads at -110 odds with a 55% win probability, yield steadier results. Over 100 bets of $100 each, you could expect a profit of $500, with a standard deviation of $950.
High-variance bets, like underdog moneylines at 3.50 odds with a 31.4% win probability, offer higher potential profits - $1,000 over 100 bets - but come with massive swings. In fact, there’s a 25% chance you could end up with a loss by season’s end.
| Metric | Low-Variance (Spreads, -110 Odds) | High-Variance (Underdog ML, 3.50 Odds) |
|---|---|---|
| Expected Profit (100 Bets) | $500 | $1,000 |
| Standard Deviation | $950 | Significantly Higher |
| Win Rate | 52%–55% | 30%–40% |
| Recommended Bankroll % | 1%–2% | 0.5%–1% |
"Standard deviation grows with the square root of the number of bets... This is why advantage gamblers want to make as many +EV bets as possible - the expected value grows faster than the uncertainty." – Joey Shackelford, Wizard of Odds
Conclusion: Using Line Variance to Bet Smarter
Line variance offers a clear path to uncovering value and steering clear of costly errors. By keeping an eye on how odds shift before kickoff, you can tap into the same insights that professionals rely on to consistently outperform closing lines. It’s the difference between taking a wild guess and making decisions grounded in solid market analysis.
The secret lies in pairing variance tracking with disciplined bankroll management. Adjusting your bet sizes based on variance levels helps cushion the impact of market swings. For instance, when sharp money validates your model’s edge through reverse line movement, you can confidently raise your wager to 1.25 or 1.5 units.
"Winning the 'price battle' consistently is a far stronger predictor of success than a few lucky wins." - J. Jefferies, CoreSportsBetting
Technology has made this process even more efficient. Tools like WagerProof simplify variance tracking by automatically identifying outliers and value bets in real-time. Instead of manually scouring multiple sportsbooks for line discrepancies or decoding steam moves, the platform’s Edge Finder highlights mismatched spreads and flags opportunities to fade games. Meanwhile, WagerBot Chat connects you to live professional data, offering accurate, on-the-spot analysis whenever you need it.
To apply these strategies, start monitoring your Closing Line Value (CLV) today - this is the most reliable benchmark for evaluating your betting process. Bettors who use specialized software report beating the closing line over 80% of the time. For even more insights, consider joining the platform’s exclusive Discord community, where seasoned bettors share how they’ve turned variance into a measurable and actionable advantage.
FAQs
How can I tell the difference between sharp money and normal market movement?
Sharp money and typical market trends can sometimes look alike, but there are distinct differences if you know what to watch for. Sharp money tends to trigger quick and noticeable line shifts across multiple sportsbooks, often early in the betting cycle. On the flip side, moves driven by public bets usually happen later and progress more gradually as casual bettors place their wagers.
Another giveaway is reverse line movement - when the line shifts against the majority of public bets. This usually signals that sharp bettors are backing the less popular side, causing sportsbooks to adjust their lines. In contrast, when lines move in the same direction as public sentiment, it’s often just a reflection of routine market behavior.
To spot these patterns, focus on the timing, speed, and consistency of line changes across sportsbooks. Tools like WagerProof’s real-time data can be a game-changer, helping you identify sharp money moves and uncover potential opportunities in the betting market.
How can I adjust my bet sizes based on line variance?
To keep your betting risk in check, it’s important to adjust the size of your wagers based on how much the lines fluctuate. When you encounter high variance - like significant line shifts or unpredictable markets - it’s smart to place smaller bets. On the other hand, in low-variance situations, such as steady lines or point spreads, you can afford to bet a bit more.
Begin by establishing your bankroll and deciding on a base unit for your bets, typically between 1% and 3% of your total bankroll. For high-variance scenarios, stick closer to the 1% mark, while for more stable, low-variance situations, you can edge closer to 3%. If you spot a strong opportunity, like a favorable line movement, you might consider slightly increasing your wager, but always stay within your comfort zone for risk. Keeping track of your results over time will help you fine-tune your approach and boost your performance in the long run.
What is Closing Line Value (CLV), and why is it important for my betting strategy?
Closing Line Value (CLV) is a way to measure how the odds you bet on stack up against the final odds right before the game begins. If you’re consistently securing better odds than the closing line, it’s a clear sign that your betting strategy is outperforming the market.
Over time, a positive CLV indicates you’re spotting opportunities and placing smarter bets, which often translates to long-term profitability. On the flip side, if your CLV is neutral or negative, it could signal that your approach needs tweaking, as it might result in breaking even or even losses. Keeping track of CLV helps you fine-tune your strategy and stay ahead in the betting game.
Related Blog Posts
Ready to bet smarter?
WagerProof uses real data and advanced analytics to help you make informed betting decisions. Get access to professional-grade predictions for NFL, College Football, and more.
Get Started Free