Linear vs. Logistic Regression in Sports Betting
Betting on sports often comes down to choosing the right statistical model and comparing real-time sports data platforms to predict outcomes. Here’s the bottom line:
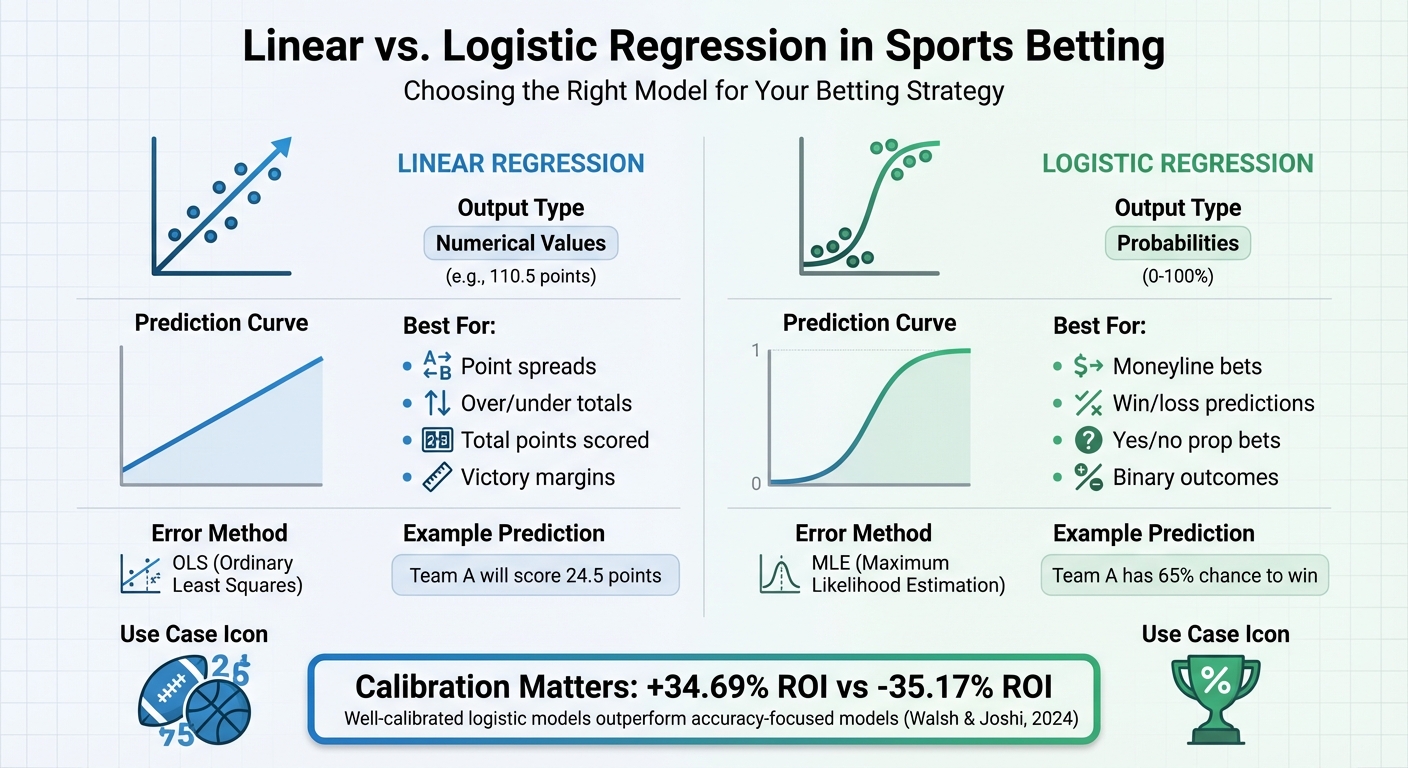
- Linear regression predicts specific numbers, like total points or victory margins. Ideal for bets like point spreads or over/under totals.
- Logistic regression predicts probabilities of binary events, like win/loss or yes/no outcomes. Best for moneyline bets and prop bets.
Key takeaway? Use the right model for the right bet. For example, if you're estimating a team's chances of winning, logistic regression ensures probabilities stay realistic (0–100%) compared to linear regression, which can produce nonsensical results. Studies even show that well-calibrated logistic models can yield higher ROIs, like +34.69%, compared to models focused only on accuracy.
Quick Comparison:
| Feature | Linear Regression | Logistic Regression |
|---|---|---|
| Output | Numerical (e.g., 110.5) | Probability (e.g., 65%) |
| Best For | Point spreads, totals | Moneyline, prop bets |
| Prediction Curve | Straight line | S-curve (sigmoid) |
| Error Handling | OLS (penalizes large errors) | MLE (handles probabilities better) |
The choice isn’t just theoretical - it directly impacts your betting strategy. Use linear regression for precise score predictions and logistic regression for binary outcomes. Calibration is key for success. For more professional-grade insights, explore WagerProof's data-driven sports betting analytics.
Linear vs Logistic Regression for Sports Betting: Key Differences
Making a Modeler - S1E4 - Introduction to Linear Regression and Logistic Regression
What is Linear Regression?
Linear regression is a statistical technique used to analyze the relationship between a dependent variable (the outcome you're predicting) and one or more independent variables (factors influencing that outcome). In sports betting, this often means using historical data - like team stats or player performance - to forecast outcomes such as total points scored, victory margins, or individual player stats.
The method works by fitting a line to historical data using least squares, resulting in a formula that connects past performance to future predictions. The output is always a continuous value - for example, "Team A is projected to score 112.5 points" or "The expected margin of victory is 8.3 points".
How Linear Regression Works
Linear regression relies on a few key components: the dependent variable (the target outcome, such as total points scored), independent variables (predictors like shooting percentages or turnover rates), an intercept (the baseline value when all predictors are zero), and coefficients that quantify how each predictor influences the outcome.
"Linear regression is just a method of finding the relationship between one variable and another. In sports betting, this often means using historical stats to predict future outcomes." - UnderdogChance
The model assumes a linear relationship between variables, normally distributed data, and independent errors. Ignoring these assumptions - for example, forcing a linear relationship where none exists or using predictors that are too closely correlated - can lead to overfitting, making the model unreliable for real-world betting.
Using Linear Regression for Sports Betting
Linear regression is particularly useful in betting scenarios that require accurate numerical predictions. This includes forecasting game totals (e.g., combined points or runs), point spreads (expected victory margins), player props (individual stats like rebounds or passing yards), and season-long metrics like total wins.
For instance, in June 2025, UnderdogChance developed an NBA moneyline model using data from 3,690 games spanning three seasons. Key predictors included home team field goal percentage, opponent turnovers, home points scored, and opponent road win percentage. The analysis identified home FG% and opponent turnovers as the strongest predictors, achieving a 65% accuracy rate on a test sample of 500 games. To gauge model reliability, analysts recommend aiming for an R-squared value of 0.65 or higher, which indicates how well the predictors explain the actual results.
To create a solid betting model, start with a dataset of at least 500 historical games, limit predictors to 5–6 variables to avoid overfitting, and update the data weekly during the season. Always validate your predictions on a holdout sample - games not included in the training data - before placing bets. This method is especially effective for markets requiring precise numerical estimates, like game totals or point spreads. However, for binary outcomes (e.g., win/loss predictions), logistic regression is a better fit.
What is Logistic Regression?
Logistic regression is a statistical method used to predict the probability of a binary or categorical outcome - like win/loss, yes/no, or over/under - based on one or more independent variables. For example, in sports, these variables might include team stats, player performance, or other measurable factors. Unlike linear regression, which can produce results outside the 0 to 1 range (making it unsuitable for probabilities), logistic regression uses a logistic (sigmoid) function to ensure all predictions fall between 0 and 1, representing valid probabilities.
The model calculates "log-odds", which is the natural logarithm of the odds (the ratio of success probability to failure probability). This approach has been a cornerstone for handling binary outcomes. In sports betting, logistic regression is particularly useful because it allows bettors to calculate precise probabilities for outcomes and compare them to the bookmaker's implied probabilities to spot potential "value" bets.
"Using logistic regression to predict soccer match winners is one of the most underrated ways to bring some real science into your sports betting."
– Underdog Chance
How Logistic Regression Works
At its core, logistic regression transforms a linear combination of input variables into probabilities using the logistic function, defined as:
1 / (1 + e^-z)
Here, z represents the weighted sum of the input features. This function creates an S-shaped curve that compresses all outputs into the 0 to 1 range, making it ideal for classification tasks.
One important concept in logistic regression is the odds ratio, which helps explain how changes in input variables affect the probability of an outcome. For example, an odds ratio of 2 doesn’t mean the probability doubles. If a team’s win probability starts at 40% (odds of 2/3), doubling the odds to 4/3 increases the probability to about 57%, not 80%. This is because logistic regression works multiplicatively: a one-unit increase in a feature multiplies the odds by e^β (where β is the coefficient for that feature). While this multiplicative behavior might seem less intuitive than linear regression’s additive approach, it’s crucial for handling probabilities near 0 or 1, where linear models often fail.
"The logistic model is unavoidable if it fits the data much better than the linear model... It's only when you have a really wide range of probabilities - say .01 to .99 - that the linear approximation totally breaks down."
– Paul von Hippel, Associate Professor, University of Texas
Using Logistic Regression for Sports Betting
Logistic regression is particularly effective for binary betting scenarios, such as predicting whether a team will win (moneyline bets), if a game will exceed a certain number of points (over/under), or whether a player will score (yes/no prop bets). The model’s ability to output probabilities - like "Team A has a 75% chance to win" - gives bettors a clear way to compare their predictions against the bookmaker’s implied probabilities and identify potential value bets.
A study by researchers Conor Walsh and Alok Joshi, published in February 2024, analyzed NBA betting using several seasons of data. They found that focusing on calibration (how closely predicted probabilities match actual outcomes) led to a +34.69% ROI. In contrast, models focused solely on win/loss accuracy resulted in a -35.17% ROI. This highlights the importance of a well-calibrated logistic model in sports betting, emphasizing that precision in probabilities often outperforms simple accuracy.
When building a logistic regression model for sports betting, it’s best to start with 3–5 key variables, such as expected goals, home/away status, and recent form. From there, you can gradually add more complex features. Be cautious of "separation", where a single feature perfectly predicts the outcome, as this can cause the model to fail due to infinite weights. For sports with three possible outcomes, like soccer (Win, Draw, Loss), multinomial logistic regression is a natural extension that can handle multiple categories effectively. This ability to produce clear probabilities is a significant advantage over linear regression, which we’ll examine further in the next section.
Main Differences Between Linear and Logistic Regression
Both linear and logistic regression models rely on statistical relationships to make predictions, but they serve different purposes. Linear regression is used for predicting continuous numerical values - like a team’s total points or the margin of victory. On the other hand, logistic regression focuses on predicting probabilities for categorical outcomes, such as whether a team will win or lose.
Linear regression assumes a straightforward, linear relationship between input variables (e.g., player stats or team performance) and the output. Logistic regression, however, models the relationship between the inputs and the log-odds of an outcome, resulting in an S-shaped sigmoid curve. This curve is essential because it restricts predictions to the 0–1 range, which aligns perfectly with probability-based predictions.
The two also differ in how they handle errors. Linear regression uses Ordinary Least Squares (OLS) to minimize squared errors, which means large errors are penalized more heavily. Logistic regression, in contrast, employs Maximum Likelihood Estimation (MLE). This method penalizes errors at a constant level as they grow, making it less sensitive to outliers. This characteristic makes logistic regression particularly reliable in unpredictable scenarios like sports betting, where unusual performances can skew predictions.
"Linear regression is usually solved by minimizing the least squares error of the model to the data, therefore large errors are penalized quadratically. Logistic regression is just the opposite... large errors are penalized to an asymptotically constant."
– J. Abrahamson
Another key distinction lies in their assumptions about data distribution. Linear regression assumes that residuals follow a normal distribution, while logistic regression assumes a binomial distribution for the dependent variable. As a result, linear regression can produce predictions outside the 0–1 range, which isn’t suitable for probabilities. Logistic regression, on the other hand, ensures its outputs stay within valid probability limits.
Comparison Table: Linear vs. Logistic Regression
| Feature | Linear Regression | Logistic Regression |
|---|---|---|
| Dependent Variable | Continuous (e.g., 110.5 points) | Categorical/Binary (e.g., Win/Loss) |
| Output Type | Specific Number | Probability (0 to 1) |
| Mathematical Curve | Straight Line | S-Curve (Sigmoid) |
| Error Minimization | Ordinary Least Squares (OLS) | Maximum Likelihood Estimation (MLE) |
| Distribution | Normal / Gaussian | Binomial |
| Betting Use Case | Point Spreads, Over/Under totals | Moneyline, Yes/No Prop bets |
These differences make it easier to choose the right model for specific applications, especially in sports betting, where the type of bet often dictates the model selection.
Understanding Model Outputs: Numbers vs. Probabilities
Linear regression’s outputs are numerical, making it ideal for bets like point spreads or over/under totals. For example, it might predict that "Team A will score 24.5 points" or "the margin of victory will be 7.3 points". Logistic regression, in contrast, generates probabilities, such as "Team A has a 65% chance of winning." These probability estimates are particularly useful for moneyline bets and yes/no proposition bets.
"A linear model does not output probabilities, but it treats the classes as numbers (0 and 1) and fits the best hyperplane... it simply interpolates between the points, and you cannot interpret it as probabilities."
– Christoph Molnar, Author
In February 2024, researchers Conor Walsh and Alok Joshi demonstrated the importance of this distinction in a study using NBA data. They found that models chosen for calibration - how closely predicted probabilities matched actual outcomes - yielded a +34.69% ROI. In contrast, models selected purely for accuracy resulted in a -35.17% loss. This underscores how, in sports betting, well-calibrated probabilities from logistic regression can outperform models that only aim to predict winners.
"For the sports betting problem, model calibration is more important than accuracy."
– Conor Walsh, Researcher, arXiv
There’s also a practical side to consider. A large-scale study revealed that switching from logistic to linear regression significantly reduced runtime - from several days to under an hour. However, while linear regression can work for probabilities in the moderate range (0.20 to 0.80), it struggles with extreme values near 0 or 1. Logistic regression remains dependable across the full probability spectrum, making it better suited for applications requiring precise probability estimates.
Choosing Between Linear and Logistic Regression
The choice between linear and logistic regression boils down to what you're trying to predict. If you're working with a continuous outcome - like total points scored, yards gained, or the margin of victory - linear regression is the way to go. On the other hand, if you're estimating the likelihood of a binary event - such as whether a team will win or if a game will exceed a certain total - logistic regression is the better option.
Probability range is another key consideration. When predicted probabilities fall within a moderate range, say between 0.20 and 0.80, both linear and logistic regression often produce similar results. However, when probabilities approach the extremes - near 0% or 100% - logistic regression has a natural advantage. Its sigmoid curve ensures predictions stay within valid probability bounds, unlike linear regression, which can produce unrealistic values.
Ease of interpretation also matters. Linear regression is straightforward: a coefficient of 0.05 means a one-unit increase in the variable corresponds to a 5 percentage point increase in probability. Logistic regression, however, operates with log odds and odds ratios, which can be trickier to explain. As Paul von Hippel, Associate Professor at the University of Texas, explains:
"The major advantage of the linear model is its interpretability... Just about everyone has some understanding of what it would mean to increase by 5 percentage points their probability of, say, voting, or dying, or becoming obese".
For sports bettors, model calibration is critical. Research by Conor Walsh and Alok Joshi highlights that selecting models based on how well predicted probabilities align with actual outcomes can significantly improve returns. One study revealed that calibration-based model selection delivered an average ROI of +34.69%, compared to a -35.17% loss when models were chosen solely based on accuracy. This distinction is especially important when employing strategies like the Kelly Criterion, which rely heavily on precise probability estimates.
Factors to Consider When Selecting a Model
Start by identifying your outcome type. Continuous outcomes - like total points or margin of victory - are ideal for linear regression, while binary outcomes - such as win/loss or cover/no cover - work best with logistic regression.
Computational efficiency is another factor. Linear regression, estimated using Ordinary Least Squares, is quick and straightforward. Logistic regression, on the other hand, relies on iterative Maximum Likelihood Estimation, which can be slower, especially with large datasets. For instance, a study found that switching from logistic to linear regression cut processing time from several days to under an hour for a dataset of 376,576 individuals.
Lastly, calibration should be a top priority when real money is on the line. Studies show that well-calibrated models outperform those selected based solely on accuracy, often leading to better betting outcomes.
Sports Betting Examples for Each Model
Linear regression shines when predicting totals and spreads. For example, it might predict an NBA game total of 215.5 points based on team efficiency, pace, and defensive metrics. It can also forecast a margin of victory, such as one team winning by 4.5 points.
Logistic regression is better suited for moneyline bets and proposition bets. In the same NBA game, it could estimate a 62% chance of a team winning outright. For player props, it might calculate a 70% probability that a specific player will hit a milestone, like scoring a touchdown or exceeding a set point total.
To illustrate, a linear regression model trained on three NBA seasons (about 3,690 games) achieved 65% accuracy in predicting winners within a test sample of 500 games. This highlights the importance of calibration - accuracy alone isn’t enough when betting real money.
How WagerProof Supports Regression Analysis

For sports bettors who rely on regression models, having access to quality data and effective tools is a game-changer. WagerProof delivers on this by offering a range of features designed to enhance your analysis.
Pro-Level Sports Data Access
WagerProof brings together prediction markets, historical stats, and public betting data into one streamlined platform. This means you no longer need to hop between multiple sources to gather metrics like team efficiency ratings, pace, or defensive stats. Everything you need is right at your fingertips.
The platform provides reliable, multi-season data that’s perfect for training both linear and logistic regression models. With a solid base of accurate data, your regression analyses can be more precise and actionable.
Automated Detection of Betting Opportunities
One standout feature of WagerProof is its ability to automatically identify outliers and potential value bets. By analyzing prediction market spreads and comparing them to expected outcomes, the platform flags discrepancies that could indicate betting opportunities.
For bettors using their own regression models, these automated alerts act as an additional layer of confirmation. For example, if your logistic regression model predicts a high win probability for a team and WagerProof flags a mismatch in the market spread, you’ve got two pieces of evidence pointing to a potential edge. This saves time and helps you focus on making informed bets instead of endlessly combing through market data.
Clear Tools and Educational Resources
WagerProof doesn’t just provide data - it also helps you understand it. The platform explains why certain bets are flagged as valuable, breaking down the statistical principles behind its recommendations. With features like WagerBot Chat, you can ask questions about model outputs and probability calculations, all powered by live professional data.
The platform is accessible at a price comparable to a standard wager, and it even offers a free trial so you can test its features before committing. Whether you’re new to regression models or looking to refine your approach, WagerProof provides the data, tools, and community support - via its exclusive Discord - to help you apply statistical methods effectively.
Conclusion
When it comes to sports betting, the choice between linear and logistic regression plays a crucial role in shaping your strategy. Each method has its strengths depending on what you're trying to predict. Linear regression is perfect for forecasting continuous outcomes - like point spreads or total scores - where the exact numbers matter. On the other hand, logistic regression shines in binary scenarios, such as determining whether a team will win or lose or if a specific prop bet will hit.
The key difference lies in their outputs. Linear regression provides specific numerical predictions, while logistic regression delivers probabilities. This means linear regression is ideal for totals and spreads, whereas logistic regression is better suited for moneyline bets and prop wagers. For example, with moneyline bets, logistic regression allows you to compare your calculated win probability against the bookmaker's implied odds, helping you identify where the value lies.
Research backs this up. Studies have shown that models calibrated for accuracy consistently outperform those that aren’t. One compelling example comes from an NBA study, where calibration-focused models achieved an ROI of +34.69%, compared to a -35.17% loss for models selected based solely on accuracy.
To keep your models effective, regular updates and high-quality data are essential. Tools like WagerProof simplify this process by consolidating prediction markets, historical stats, and public betting data to help you build and validate your models.
Ultimately, aligning your model with the type of bet you’re placing, focusing on calibration, and updating your data regularly are critical steps to maintaining your statistical edge. By leveraging these insights and tools like WagerProof, you can continuously refine your approach and enhance your betting strategy.
FAQs
How do I turn a logistic regression win probability into a value bet?
To find a value bet using logistic regression win probabilities, compare your model's predicted probability to the sportsbook's implied probability. Then, calculate the expected value (EV). If your model's probability is higher than the implied probability, the bet offers a positive EV. This approach helps you pinpoint opportunities where the market odds underestimate an outcome. From there, adjust your stake based on the EV and your personal risk management plan.
What’s the easiest way to check if my model is well-calibrated?
The simplest way to determine if your model is calibrated correctly is by using probability bins and reliability plots. These tools allow you to compare your model's predicted probabilities with the actual outcomes. By identifying gaps between predictions and reality, you can pinpoint areas for improvement and boost the model's accuracy.
How many games and predictors do I need before trusting a regression model?
To create a dependable regression model, you'll typically need at least 30 games in your dataset and 10 or more predictors. That said, the exact numbers can vary based on how complex your model is and the quality of the data you're working with. The key is to ensure your dataset is strong enough to reveal meaningful patterns while minimizing the risk of overfitting, especially when incorporating multiple predictors.
Related Blog Posts
Ready to bet smarter?
WagerProof uses real data and advanced analytics to help you make informed betting decisions. Get access to professional-grade predictions for NFL, College Football, and more.
Get Started Free