5 Metrics for Assessing Betting Model Accuracy
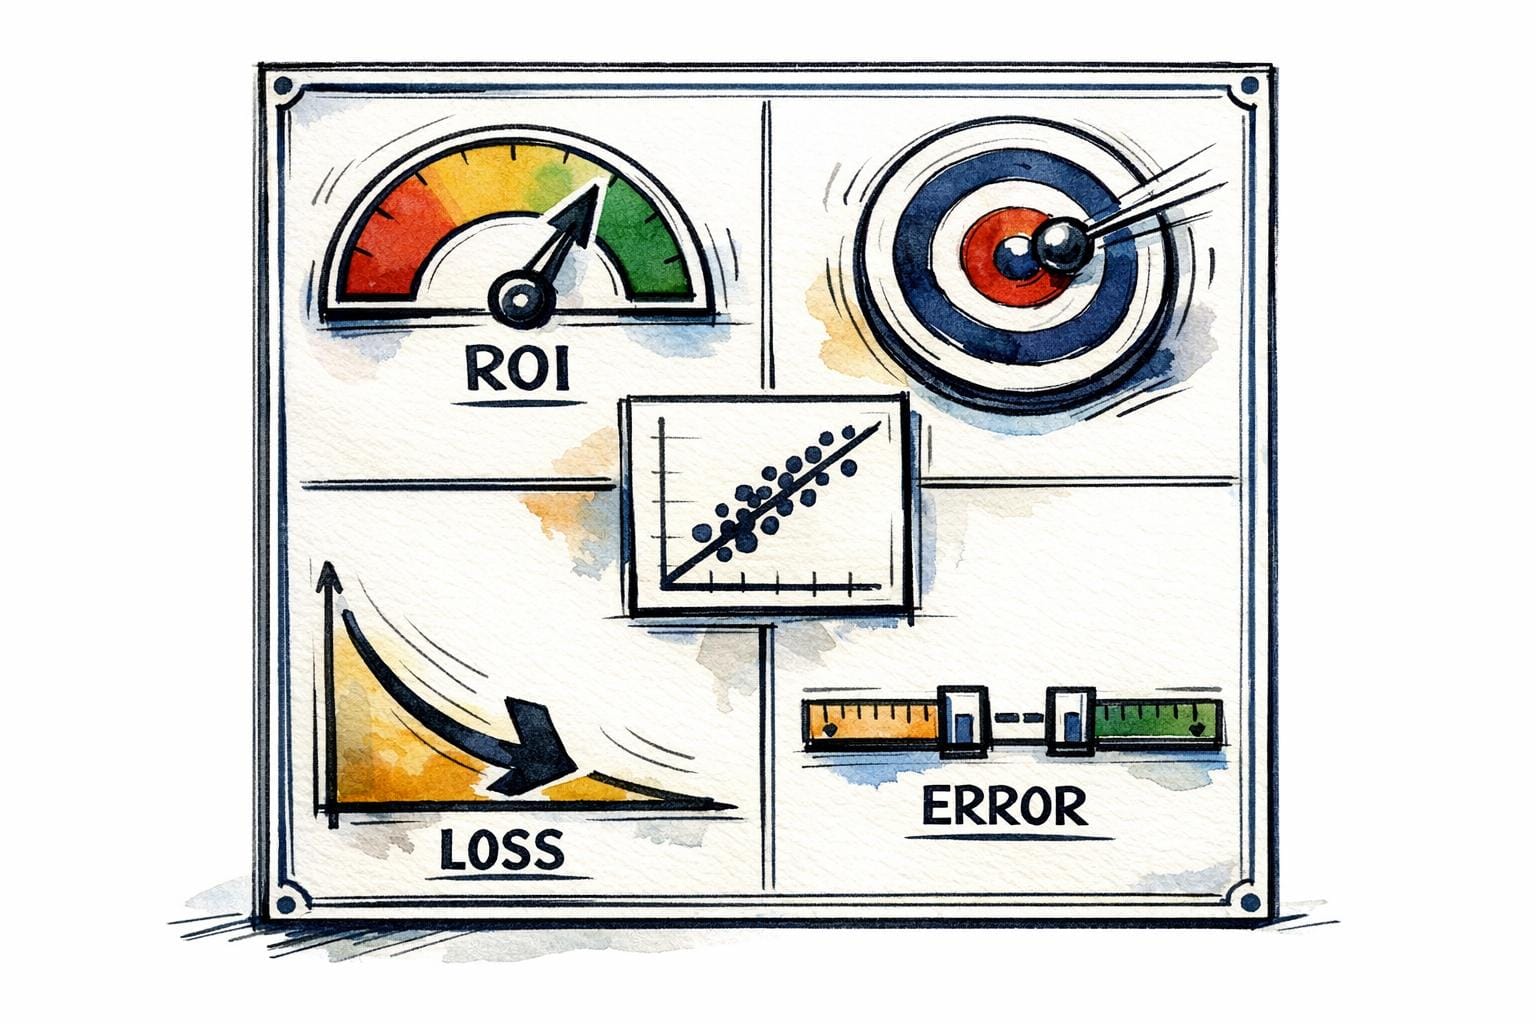
When evaluating the accuracy of a betting model, relying on a single metric can lead to incomplete conclusions. Instead, a combination of metrics provides a more accurate picture of performance. Here are five key metrics you should focus on:
- ROI (Return on Investment): Measures profitability relative to the amount wagered. A long-term ROI of 3–7% is typical for professional models.
- Hit Rate: Tracks how often your predictions are correct. However, it’s not enough on its own since profitability depends on odds and payouts.
- Log Loss: Assesses the precision of probability predictions, penalizing overconfidence more than underconfidence.
- Calibration: Ensures predicted probabilities align with actual outcomes, which is critical for effective stake sizing and decision-making.
- MAE (Mean Absolute Error): Measures average prediction error, particularly useful for continuous outcomes like point spreads or totals.
Each metric serves a unique role. ROI confirms profitability, while hit rate shows prediction frequency. Log loss and calibration focus on the reliability of probability estimates, and MAE identifies prediction errors. Together, they provide a comprehensive evaluation of a betting model’s performance.
For better results, use tools like WagerProof to automate metric tracking and analyze performance in real time.
AI Football Predictions Reviewed: Weekly Results, Errors & the v8.17 Fix Plan
1. ROI (Return on Investment)
ROI measures how much profit you make for every dollar you bet. The formula is simple: (Net Profit / Total Amount Placed) × 100. For instance, if you earn a $350 net profit from $5,000 in bets, your ROI is 7%. This metric helps you understand how efficiently your model uses capital and sets the foundation for evaluating its overall performance.
Here's the catch: even if you win 60% of your bets on heavy favorites, you could still end up losing money if the payouts don’t make up for your losses. As sportsbook expert Patrick Cwiklinski puts it:
"Optimizing for ROI is essential to profitable sports betting".
For professional-level models, a long-term ROI typically falls between 3% and 7%. Anything higher over a large number of bets is rare and often signals an exceptional model. However, to draw reliable conclusions, you need a sample size of at least 100 to 1,000 bets. Smaller samples can produce misleading results due to short-term variance.
To fine-tune your strategy, track ROI separately across different sports, leagues, and bet types (like moneylines or spreads). This approach helps you pinpoint where your model performs well and where it might need adjustments. A positive ROI is a strong indicator that your model is uncovering true market inefficiencies. While ROI gives you a solid profitability benchmark, other metrics can help refine your model's accuracy even further.
Tools like WagerProof's Edge Finder can enhance your analysis by identifying value bets and spotting market outliers in real time. Pair it with WagerBot Chat to compare your model’s predictions against live professional data, ensuring your edge is backed by solid insights.
2. Hit Rate
Hit rate tells you how often your model correctly predicts winners. You can calculate it using this formula: (Winning Bets / Total Bets) × 100. For instance, if you place 200 bets and win 120 of them, your hit rate would be 60%.
However, having a high hit rate doesn't automatically mean you're making a profit. Here's why: a 60% hit rate on bets with -200 odds might still result in a loss, while a 40% hit rate on bets with +200 odds could turn out profitable. The odds you receive play a crucial role. Since sportsbooks include a margin (often 5–10%), breaking even on even-money bets requires a hit rate higher than 50%. At a 5% margin, for example, you'd need about 52.6% just to break even, with 55% often being a more realistic target. This means hit rate alone doesn't tell the full story - it must be evaluated alongside other metrics.
Research into NBA betting models has shown that aligning predictions with actual outcomes can improve ROI more effectively than focusing purely on hit rate. To get a clearer picture, track your hit rate across different sports and bet types while also monitoring metrics like ROI, Expected Value, and Closing Line Value. For reliable insights, use samples of several hundred bets.
Tools like WagerProof’s statistical models can help you compare your hit rate to live market data. This ensures your predictions are based on accurate probabilities rather than just chasing frequent winners at less favorable odds.
3. Log Loss
Log loss, also called the logarithmic score, evaluates how well your model's probability estimates match actual outcomes. Unlike metrics like ROI and hit rate, which focus on profitability and win frequency, log loss zeroes in on the accuracy of your probability predictions. This makes it especially useful in sports betting, where understanding the exact win probability - not just identifying the favorite - can help you uncover value in bookmaker odds. Its emphasis on probability precision offers a deeper layer of performance analysis compared to hit rate.
For binary outcomes, log loss is calculated as -log(p) when the event occurs and -log(1-p) when it doesn’t. The goal? Achieve a lower score. A perfect prediction results in a log loss of zero. But here’s the catch: log loss heavily penalizes overconfidence. If your model assigns a very low probability to an event that happens, the penalty can skyrocket toward infinity.
"The log score penalises overconfidence more strongly than underconfidence (in probability space)." - Nikos Bosse
This penalty structure is vital for building effective betting models. For instance, if the true probability of an event is 70%, predicting 85% (overconfidence) results in a deviation of approximately 0.0717, while predicting 55% (underconfidence) leads to a smaller deviation of about 0.0474. Log loss, as a proper scoring rule, encourages models to report probabilities as accurately as possible, minimizing the risk of manipulation.
The importance of accurate probability estimation is further highlighted in research on NBA betting systems. Models that focused on minimizing probability errors using log loss achieved an impressive average ROI of +34.69%. In contrast, models relying solely on accuracy suffered a steep -35.17% loss. As Conor Walsh and Alok Joshi aptly put it:
"A highly accurate predictive model is useless as long as it coincides with the bookmaker's model".
These findings have practical applications. WagerProof, for example, integrates these principles into its statistical models to identify when your probability estimates differ significantly from market odds. This approach helps reveal genuine betting opportunities. Ultimately, metrics like log loss are indispensable for validating models and gaining an edge in sports betting.
4. Calibration
Calibration measures how well a model's predicted probabilities align with actual outcomes. For example, if a model predicts a 60% chance of a team winning, that team should win about 60% of the time over multiple predictions. While it’s one thing for a model to correctly predict winners, it’s another to provide probability estimates that accurately reflect the true likelihood of those outcomes. These probabilities are critical - they directly affect calculations for betting edges and stake sizes. A model that frequently picks winners but misjudges probabilities can still lead to poor decision-making.
Research highlights the importance of calibration in betting performance. A study by Conor Walsh and Alok Joshi, published in Machine Learning with Applications (June 2024), revealed that models selected for their calibration achieved an average ROI of +34.69%. In contrast, models chosen purely for accuracy had an ROI of -35.17%. This stark difference underscores the value of prioritizing calibration over accuracy when evaluating models for betting purposes.
To assess calibration, tools like the Brier Score are commonly used. The Brier Score calculates the mean squared error between predicted probabilities and actual outcomes, with a score of 0 indicating perfect calibration. Another method involves reliability curves (or calibration curves), which plot predicted probabilities against observed outcomes. A perfectly calibrated model will follow the diagonal line on the graph, where predictions match reality.
If your model tends to be consistently overconfident or underconfident, recalibration techniques such as Platt Scaling or Isotonic Regression can help fine-tune probability estimates. These adjustments ensure that predictions better reflect true likelihoods, improving the model's reliability.
At WagerProof, these calibration principles are embedded into our models, ensuring they provide dependable probability estimates to support smarter betting decisions.
5. MAE (Mean Absolute Error)
Mean Absolute Error (MAE) calculates the average size of prediction errors, without paying attention to whether those errors are positive or negative. In sports betting, this metric is particularly handy for continuous outcomes - like point spreads, over/under totals, or individual player scores - because it's expressed in the same units as the data being analyzed. This makes it straightforward to understand and apply.
To find MAE, you simply take the average of the absolute differences between your predictions and the actual results. For example, if you predicted a total of 215.5 points and the actual total was 218, the error would be 2.5 points. By averaging such errors across multiple games, you get a clear picture of how far off your predictions are, on average.
One of MAE's strengths is its resilience to outliers. Unlike Root Mean Squared Error (RMSE), which squares errors and gives more weight to larger deviations, MAE treats all errors equally. This linear approach ensures that extreme outliers don’t disproportionately impact the overall error measurement.
"The mean value of distribution minimises RMSE, and the median value minimises MAE." - Ivan Svetunkov, Assistant Professor, Lancaster University
MAE serves as a vital part of your evaluation toolkit. It helps you understand your model's average deviation in terms that are easy to relate to real-world outcomes. However, remember that even a model with a low MAE might not be profitable if it fails to spot betting opportunities based on sportsbook odds. When used alongside metrics like ROI, hit rate, log loss, and calibration, MAE provides a well-rounded view of your model’s performance.
Metric Comparison Table
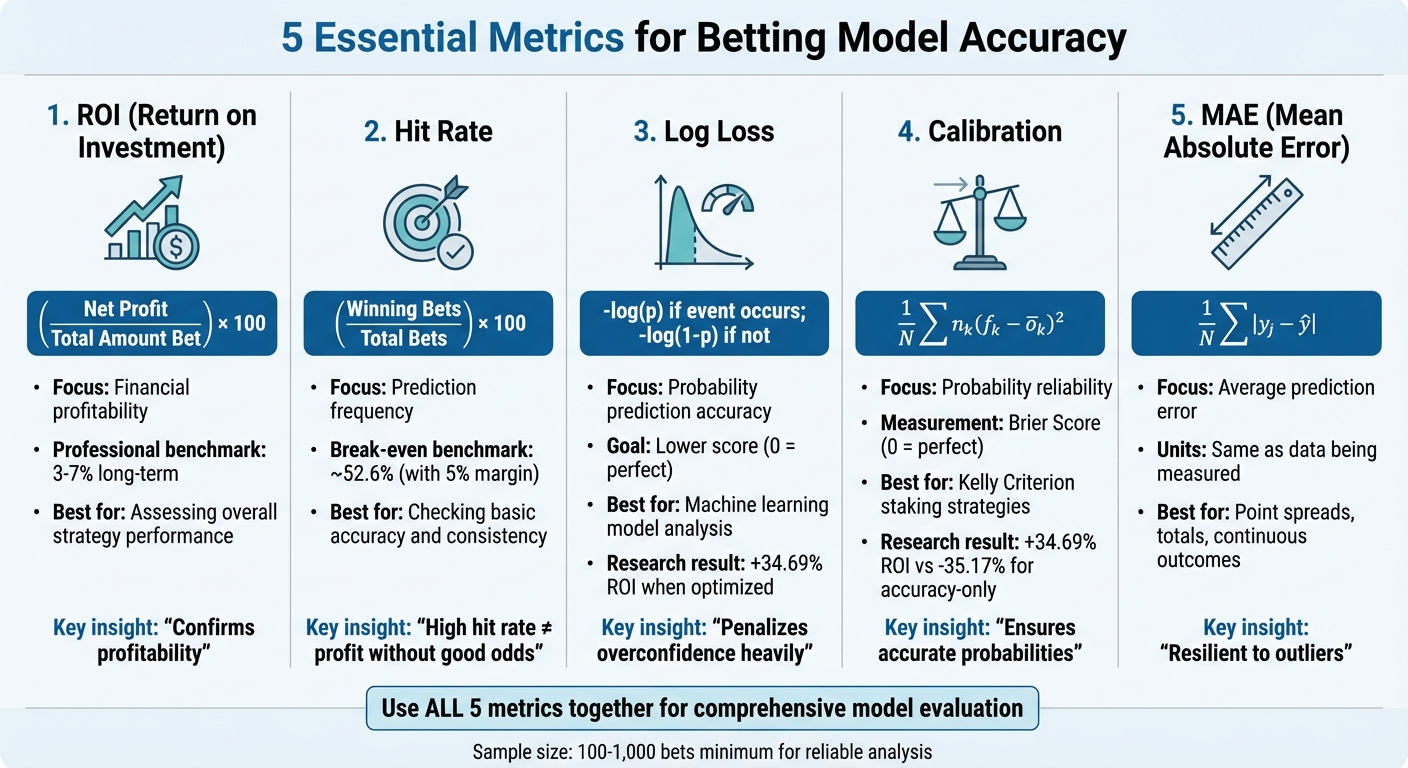
5 Key Metrics for Betting Model Accuracy Comparison
Below is a quick-reference table comparing key metrics. Use it to guide how you incorporate these metrics into your betting strategy.
| Metric | Formula | Metric Focus | When to Use |
|---|---|---|---|
| ROI | (Net Profit / Total Amount Bet) × 100 | Measures financial profitability | Assessing overall strategy performance |
| Hit Rate | (Winning Bets / Total Bets) × 100 | Tracks frequency of correct predictions | Checking basic accuracy and model consistency |
| Log Loss | -log(p) if y=1; -log(1-p) if y=0 | Evaluates accuracy of probabilistic predictions with penalties for overconfidence | Analyzing probability estimates in machine learning models |
| Calibration | (1/N) Σ n_k (f_k - ō_k)² | Tests reliability of predicted probabilities | Ensuring accurate probabilities for strategies like Kelly Criterion staking |
| MAE | (1/N) Σ |y_j - ŷ| | Measures average prediction error in real units | Useful for continuous outcomes like point totals or spreads |
Each metric serves a unique purpose. ROI helps confirm whether your approach is profitable, while metrics like calibration, log loss, and MAE provide deeper insights into prediction accuracy and error margins. Hit rate, on the other hand, gives a straightforward look at how often your predictions are correct.
When used together, these metrics provide a well-rounded evaluation of your model. For instance, a model might have a hit rate under 50% but still generate a positive ROI if it consistently identifies undervalued underdogs. On the flip side, a model with high accuracy but poor calibration could lead to incorrect stake sizing, reducing expected value over time.
Keep in mind that large sample sizes are critical for reliable analysis. Metrics drawn from small datasets can be skewed by short-term variance, so always aim for robust data to ensure meaningful insights.
Conclusion
Relying on a single metric - like hit rate or accuracy - can be a risky strategy. For example, research on NBA betting models highlights this danger: calibration-based selections achieved an ROI of +34.69%, while accuracy-based picks ended up with a dismal -35.17% ROI. This underscores the importance of balancing multiple metrics to form actionable strategies.
Each metric serves a distinct purpose. ROI confirms profitability, while hit rate measures how often predictions are correct. Log loss and calibration assess the reliability of probability estimates, crucial for determining stake sizes. Meanwhile, MAE helps identify prediction errors early, giving you a chance to address instability before it affects your bankroll. Together, these metrics provide a comprehensive view of a model's performance and guide decisions on bet sizing and market selection.
WagerProof simplifies this process by automating the evaluation of these metrics, turning them into practical betting insights. Manual tracking can’t keep up with the pace of real-time data, but WagerProof's tools - like the Edge Finder, AI Game Simulator, and historical analytics - make it easy to identify value bets, refine calibration, and track performance across meaningful sample sizes. Plus, WagerBot Chat offers real-time validation, helping to cut down on emotional decision-making.
Expert benchmarks and automated alerts ensure your strategies remain effective. By combining streamlined analysis with real-time validation, you can confidently confirm a model's edge.
The betting landscape is always shifting - teams evolve, public sentiment changes, and sportsbook lines adjust. That’s why regular reliability checks and recalibrations are essential. With WagerProof’s automated tools and focused research on high-value opportunities, you can adapt to market changes and maintain your edge over time.
FAQs
What are the best metrics to combine for evaluating the accuracy of my betting model?
To properly assess your betting model, it’s essential to use a mix of metrics that capture different performance aspects. Key ones to focus on include ROI (Return on Investment) for measuring profitability, hit rate for gauging prediction accuracy, and log loss or the Brier score to check how well your predicted probabilities match actual results.
Using these metrics together gives you a more complete picture of your model’s strengths and weaknesses. For instance, ROI and hit rate reveal how successful your bets are overall, while calibration metrics like log loss ensure your predictions are accurate and not overly confident. This combination of insights can guide you in fine-tuning your approach and making smarter betting decisions.
Why is calibration more important than accuracy in evaluating betting models?
Calibration plays a key role in betting models because it ensures that predicted probabilities closely match actual outcomes. This alignment helps you better understand the true likelihood of events, which is critical for managing risk and making informed betting choices.
Accuracy, on the other hand, focuses on how often a model's predictions are correct but doesn’t address whether those predictions reflect real-world probabilities. A properly calibrated model offers more dependable insights, enabling you to spot value bets and base your decisions on steady, data-backed probabilities.
Why is sample size important when evaluating betting model performance?
Sample size plays a crucial role in assessing the performance of betting models because it directly impacts the dependability and precision of your metrics. A larger sample size offers more consistent and insightful data on essential metrics like ROI, hit rate, and calibration, minimizing the effects of random variations or outliers.
On the other hand, smaller sample sizes can lead to skewed or unstable results, making it difficult to gauge a model's actual predictive capabilities. Since sports betting outcomes are naturally unpredictable, working with a sufficiently large sample helps ensure your analysis captures the model’s long-term accuracy. This, in turn, allows you to make better-informed and more confident decisions.
Related Blog Posts
Ready to bet smarter?
WagerProof uses real data and advanced analytics to help you make informed betting decisions. Get access to professional-grade predictions for NFL, College Football, and more.
Get Started Free