5 Metrics To Validate Betting Models With CLV
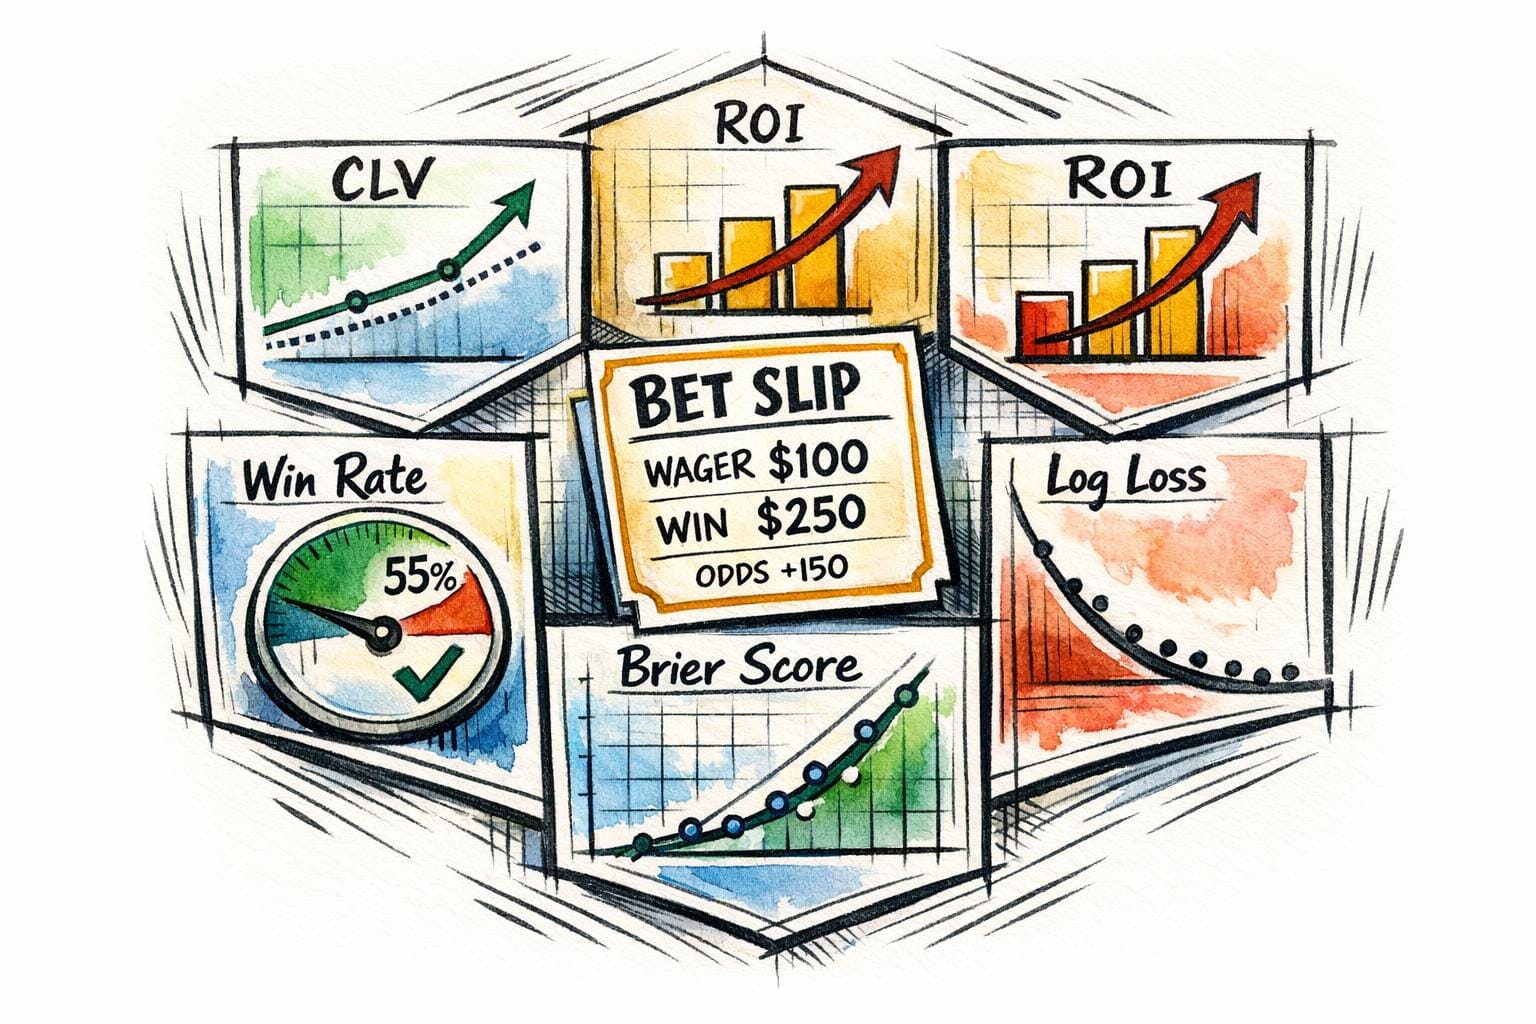
Want to know if your betting model works? Start by tracking these 5 key metrics:
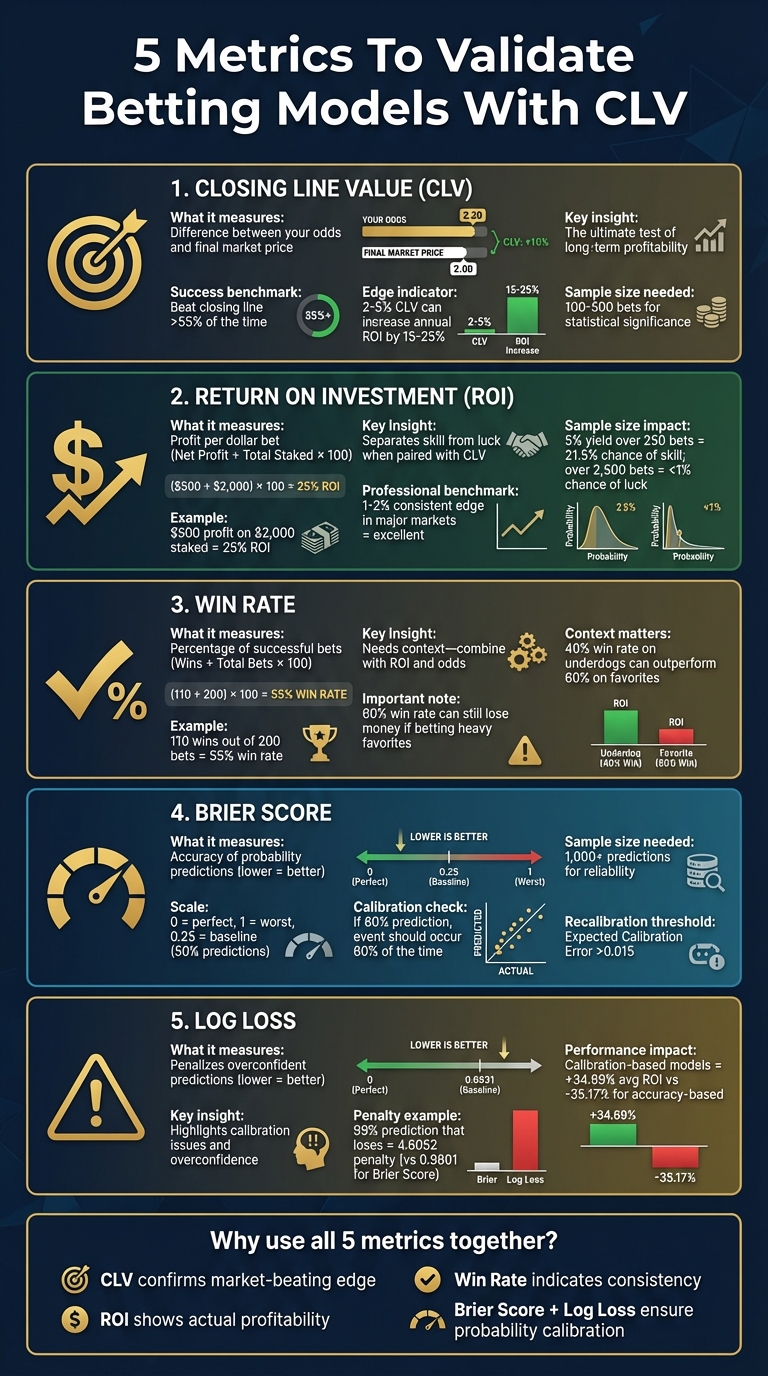
- Closing Line Value (CLV): The ultimate test of long-term profitability. Beating the closing line over 55% of the time shows your edge.
- Return on Investment (ROI): Measures how much profit you make per dollar bet. Pair it with CLV to separate skill from luck.
- Win Rate: Shows your percentage of successful bets but needs context - combine it with ROI and odds for clarity.
- Brier Score: Evaluates how accurate your probability predictions are. A lower score means better calibration.
- Log Loss: Penalizes overconfident predictions and highlights calibration issues in your model.
Why these metrics matter: CLV confirms your bets outperform the market, while calibration metrics like Brier Score and Log Loss ensure your probabilities align with outcomes. ROI and win rate round out the picture by showing actual profits and consistency. Use tools like WagerProof to track these metrics and refine your strategy.
5 Key Metrics to Validate Betting Models: CLV, ROI, Win Rate, Brier Score, and Log Loss
What Is Closing Line Value (CLV) in Sports Betting?
1. Closing Line Value (CLV)
CLV represents the difference between the odds you secured and the final market price just before an event starts. For instance, if you bet on the Buffalo Bills at -5.5 and the line shifts to -7 by kickoff, you’ve gained 1.5 points of value. In this scenario, if the Bills win by 6, your bet wins while those who wagered at the closing line lose.
"Closing line value (or CLV) is the most important factor in determining if sports bettors are profitable over time or not."
This insight comes from Ray Belkora at OddsJam, who emphasizes that the closing line reflects all available information, including injury updates, weather conditions, and sharp betting activity.
To calculate CLV properly, you need to strip away the sportsbook’s margin (the vig) from the closing line to find the fair market price. Then, compare your locked-in odds to this no-vig closing probability. For accuracy, convert American odds to implied probabilities: use the formula 100/(Odds + 100) for positive odds and Odds/(Odds + 100) for negative odds. Once you’ve calculated your CLV, its influence on your long-term performance becomes evident.
Even a small edge - around 2–5% - can significantly impact your returns, potentially increasing annual ROI by 15–25%. However, achieving statistical significance requires analyzing at least 100–500 bets. To minimize errors, log every wager manually or use tools like WagerProof to streamline tracking and focus on improving your betting model.
Timing also plays a crucial role. Placing bets early in the week - such as on Sunday for NFL games - can help you secure value before the market adjusts. Additionally, segmenting your CLV data by league, market type, and timing can reveal where your model performs best or where it might need adjustments.
2. Return on Investment (ROI)
ROI, or Return on Investment, tells you how much profit you're making for every dollar you bet. The formula is simple: divide your net profit by the total amount staked, then multiply by 100 to express it as a percentage. For example, if you’ve wagered $2,000 and earned a $500 net profit, your ROI is 25%.
While CLV gives an early glimpse into market efficiency, ROI focuses on actual profits. As professional bettor Rufus Peabody puts it:
"Return on investment is what we're all playing for, but how can we strip luck from the results?"
Short-term ROI can swing wildly due to variance. A few fortunate outcomes - like a lucky bounce or an overtime win - can temporarily boost your numbers.
The relationship between ROI and odds is also worth noting. For example, a bettor achieving a 5% yield at 1.50 odds shows the same level of skill as someone with a 10% yield at 3.00 odds or a 35% yield at 20.00 odds. In large, highly liquid betting markets, even a consistent edge of 1% to 2% is considered excellent performance.
Sample size plays a big role in determining whether your ROI is driven by skill or just luck. For instance, a 5% yield over 250 bets at 2.00 odds has a 21.5% chance of being skill-based. However, the same yield over 2,500 bets has less than a 1% chance of being purely luck. Betting analyst Joseph Buchdahl explains:
"Bigger yields are to be expected from not only shorter betting histories, but also betting at longer odds."
Grasping the nuances of sample size is crucial for interpreting ROI in relation to CLV.
Tracking ROI alongside CLV gives a fuller picture of your betting performance. If your ROI significantly outpaces your CLV, it might be wise to reduce your stakes to prepare for potential regression. On the flip side, a negative ROI paired with a positive CLV suggests your bets are sound, but luck hasn’t been on your side - stick to your strategy. Tools like WagerProof can help you monitor both metrics seamlessly across your betting history.
3. Win Rate
Win rate, also known as hit rate, measures the percentage of successful bets out of the total bets placed. The formula is simple: divide the number of winning bets by the total number of bets, then multiply by 100. For instance, if you placed 200 bets and won 110 of them, your win rate would be 55%.
However, a high win rate doesn't automatically translate to profitability. You could win 60% of your bets but still lose money if you're consistently betting on heavy favorites with minimal payouts. As UnderdogChance explains:
"A high hit rate alone doesn't guarantee profitability; it's essential to consider ROI in combination."
The problem with focusing solely on win rate is that it overlooks two crucial factors: bet sizing and odds. A strategy with a 40% win rate that targets high-value underdogs can outperform one with a 60% win rate that favors heavy favorites. Context is everything - a 55% win rate might look good in point spread betting at -110 odds, but it could still lead to losses when betting on heavily favored moneylines. This underscores the importance of pairing win rate with other metrics to get a clearer picture.
Short-term win rates can also fluctuate significantly due to variance, like overtime wins or last-second plays. DRatings highlights this unpredictability:
"Wins and losses will always be streaky and can be very poor indicators of one's actual success."
When analyzed alongside ROI and CLV, win rate becomes a more meaningful metric. These combined measures provide a better sense of a model's consistency and its ability to outperform the market, rather than relying on win rate alone. Together, they offer a more comprehensive view of your betting model's effectiveness.
4. Brier Score
The Brier Score is a key metric for assessing how well your model's probability forecasts align with actual outcomes. It evaluates the accuracy of probability predictions by calculating the average squared difference between predicted probabilities and observed results. Think of it as the mean squared error, but specifically for probabilities. The formula is:
$BS = \frac{1}{N} \sum_{t=1}^{N} (f_t - o_t)^2,$
where fₜ represents the forecasted probability, and oₜ is the actual outcome (1 if the event occurred, 0 if it didn’t).
The lower the Brier Score, the better the calibration. A score of 0 means your predictions were perfectly accurate, while a score of 1 indicates the worst possible performance. For example, if your model predicts a 60% chance of an event, that event should occur 60% of the time for your model to be well-calibrated. This calibration is crucial, especially when using data-driven betting strategies, where misaligned probabilities can lead to poor stake sizing and skewed results. Like CLV and ROI, the Brier Score helps confirm whether your predictions match real-world outcomes.
For context, a constant 50% prediction yields a Brier Score of 0.25, which serves as the baseline for unskilled forecasting. If your model can't improve on 0.25, it’s essentially no better than random guessing. To measure performance against a naive baseline, the Brier Skill Score (BSS) comes into play. A BSS of 1 indicates perfect performance, while a negative BSS shows your model is performing worse than the baseline.
The Brier Score can also be broken down into three components:
- Reliability: How closely your predicted probabilities match true frequencies.
- Resolution: How much your predictions deviate from the average probability.
- Uncertainty: The inherent randomness of the event.
If your model has poor reliability, it might consistently overestimate or underestimate probabilities. Tracking Brier Scores separately for different sports or leagues can reveal areas where your model's calibration is slipping. If your Expected Calibration Error exceeds 0.015, recalibration methods like Platt Scaling might be necessary.
Unlike metrics that heavily penalize extreme errors, the Brier Score provides a stable and balanced measure for validation. It’s particularly effective for rare events, but you'll need a sample size of at least 1,000 predictions to ensure the results are reliable. This makes it more suitable for long-term validation rather than quick performance checks. By tracking the Brier Score over a large number of predictions, you can gain a clearer picture of your model’s overall accuracy and calibration, complementing other metrics for a well-rounded evaluation.
5. Log Loss
Log Loss is a metric that takes your model evaluation a step further by penalizing overconfidence in predictions. Compared to the Brier Score, Log Loss imposes much harsher penalties for incorrect predictions made with high confidence. In fact, the penalty can grow indefinitely as your predicted probability approaches 100% for an outcome that doesn't happen. This makes it a valuable tool for assessing the risks of overconfidence in your betting model. Alongside metrics like CLV, ROI, win rate, and the Brier Score, it provides a deeper understanding of your model's predictive accuracy.
Here’s how it works: for a win, Log Loss = –ln(probability), and for a loss, Log Loss = –ln(1 – probability). A perfect model achieves a Log Loss of 0, while a constant 50% prediction results in a score of about 0.6931. In sports betting, your goal is to achieve a lower Log Loss than the sportsbook's closing line, which acts as a benchmark for profitability. If your model can't outperform this baseline, it offers no advantage over the market.
The penalty structure of Log Loss highlights its effectiveness. For instance, if your model predicts a 99% win probability but the team loses, the Log Loss penalty is 4.6052. Compare that to the Brier Score, where the penalty for the same scenario is only 0.9801. This stark difference underscores how Log Loss better accounts for the consequences of overconfidence. A study on NBA betting data showed that models selected using calibration metrics like Log Loss achieved an average ROI of +34.69%, while those chosen based on simple accuracy had an average ROI of –35.17%. The best-case ROI for calibration-based models reached +36.93%, whereas accuracy-based models peaked at just +5.56%.
"The limitation of Brier Score is that an incorrect prediction limits the max score one can have on that contest at 1. Meanwhile, log loss can go to infinity which allows for a more realistic penalty for overconfidence in predictions." – DRatings
When training machine learning models, consider using Log Loss as your objective function. Its sensitivity to probability nuances allows you to fine-tune your model's predictive edge. Monitor Log Loss across different leagues to identify where your model truly outperforms. However, keep in mind that Log Loss requires a large number of observations and well-calibrated probabilities to deliver reliable results. For a more comprehensive evaluation, pair it with the Brier Score. While Log Loss excels in optimization and identifying well-calibrated models, the Brier Score is more forgiving when your probabilities aren't perfectly refined. Together, these metrics form a well-rounded framework for evaluating your model's performance.
Conclusion
No single metric can fully capture your model's performance. However, CLV (Closing Line Value) stands out as a reliable long-term indicator. It reflects fair market adjustments and confirms your model's edge over the market, even before the market fully corrects itself. That said, it's possible to see positive CLV but negative ROI in small sample sizes - or even positive ROI with zero CLV, which usually just means you're on a lucky streak. This is where calibration metrics come in, ensuring your probabilities are both accurate and profitable.
Metrics like Brier Score and Log Loss help verify that your predicted probabilities align with actual outcomes. For example, a model might consistently beat the closing line but still be poorly calibrated. This miscalibration can lead to overconfidence, improper stake sizing, and ultimately, a drained bankroll. If your model predicts a 60% win probability, the event should occur around 60% of the time - otherwise, there's a disconnect that needs addressing.
By combining these metrics, you get a clearer picture of your model's performance. CLV confirms you're beating the market, while Brier Score and Log Loss ensure your probabilities are well-calibrated for effective stake sizing. Experts suggest that sustaining an average raw CLV of more than 1–2% in major markets is a strong signal of a genuine edge. Still, calibration metrics are crucial to avoid losing value through poorly sized bets. Tools like WagerProof simplify this process by tracking metrics in real time. They log timestamps, placed odds, and closing lines from sharp sportsbooks, calculate no-vig fair values, and provide rolling visualizations to help spot trends and shifts before they hurt your bankroll.
Successful bettors differentiate themselves by rigorously tracking these metrics. Combining CLV's market insights with ROI and calibration data offers a complete performance snapshot. This approach separates skill from luck and provides the feedback you need to continuously refine your betting strategy.
FAQs
How do I calculate no-vig CLV from American odds?
To figure out the no-vig CLV using American odds, start by converting both your bet odds and the final market odds into decimal format. Once you’ve done that, apply this formula: (Closing Odds ÷ Placed Odds) - 1. If the result is negative, it means you locked in positive value. This approach is a handy way to evaluate how precise and profitable your betting model is.
How many bets are needed for CLV or ROI to be meaningful?
To get a dependable read on long-term profitability through CLV, you’ll need a sample size of roughly 250 to 1,000 bets. Monitoring CLV across such a large number of bets helps distinguish genuine skill from mere luck, offering a more accurate view of how your betting model is performing.
What’s a good Brier Score or Log Loss for a betting model?
A good Brier Score or Log Loss is one that's as low as possible. Lower scores mean your predictions are more accurate and better calibrated. While the exact thresholds can vary depending on the sport or specific context, a Brier Score close to 0 typically signals highly precise probabilistic predictions. Both metrics are essential tools for assessing how closely your betting model's predictions match real-world outcomes.
Related Blog Posts
Ready to bet smarter?
WagerProof uses real data and advanced analytics to help you make informed betting decisions. Get access to professional-grade predictions for NFL, College Football, and more.
Get Started Free