How Model Accuracy Affects Betting ROI
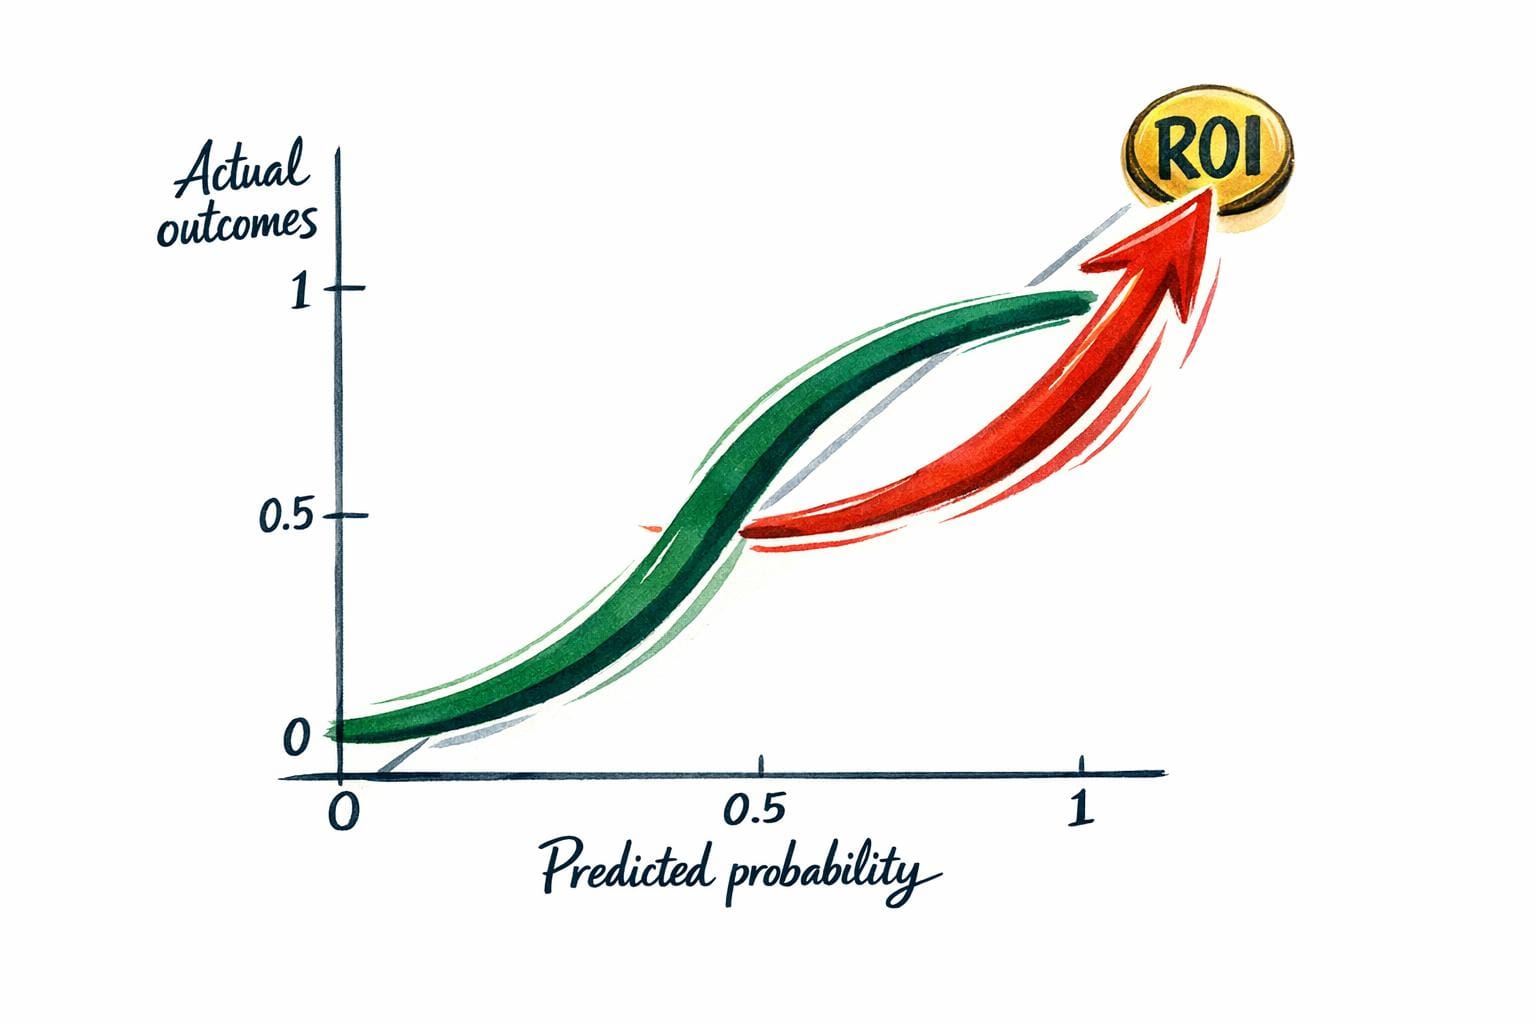
High accuracy doesn’t guarantee profits in sports betting. Even with a 60% win rate, poor odds or overconfidence can lead to losses. The key to profitability lies in calibration - aligning predicted probabilities with actual outcomes. A well-calibrated model helps identify value in odds, avoid overbetting, and manage risks effectively.
Key points:
- ROI matters more than win rate: Return on Investment (ROI) measures profit relative to the amount wagered.
- Accuracy vs. Calibration: Accuracy predicts winners; calibration ensures probability estimates match real outcomes.
- Odds and value betting: Betting on poor odds, even with high accuracy, leads to losses. Identifying favorable odds is critical.
- Break-even thresholds: At standard -110 odds, you need at least 52.4% accuracy to break even.
- Calibrated models outperform: Studies show calibration-based models can improve ROI by over 30 percentage points compared to accuracy-focused ones.
To succeed, focus on calibrated models, proper bet sizing, and spotting value in odds - not just picking winners.
Why High Accuracy Doesn't Always Mean Profit
Accuracy vs. Calibration: What's the Difference?
Let’s dig into how accuracy and calibration differ and why this matters for turning a profit. Accuracy tells you how often a model predicts the winner correctly. For example, if a model predicts 60 winners out of 100 games, its accuracy is 60%. Calibration, however, looks deeper - it checks if the predicted probabilities match actual outcomes. If a model says there’s a 70% chance of winning, calibration ensures that about 70 out of 100 similar games actually result in wins.
This distinction is key because betting success hinges on spotting value in the odds, not just picking winners. A calibrated model can uncover when sportsbooks have mispriced a game. On the other hand, a model focused on accuracy might simply echo the bookmaker's probabilities, leaving no edge to exploit. This gap in understanding probabilities often leads to common pitfalls for bettors.
In June 2024, Conor Walsh and Alok Joshi from the University of Bath published a study in Machine Learning with Applications that analyzed NBA betting data over several seasons. Their findings were striking: models chosen for their calibration achieved a +34.69% return on investment (ROI), while models selected based solely on accuracy suffered a -35.17% loss. That’s a swing of nearly 70 percentage points. Even more impressively, the best-calibrated models hit a +36.93% ROI, compared to just +5.56% for the top accuracy-based models.
Common Mistakes: Bad Odds and Overconfidence
A major trap for bettors is overbetting on favorites - a mistake often fueled by overconfidence in accuracy-focused models. These models tend to inflate probabilities, such as assigning a 90% chance of winning when the real likelihood is closer to 60%. This overconfidence leads to heavy betting on favorites at unfavorable odds, which backfires when unexpected outcomes occur.
Take the 2024 NFC Championship game between the Detroit Lions and San Francisco 49ers. Many accuracy-driven models gave the Lions an 85% chance of winning and recommended bets at -200 odds. Bettors who trusted these high-confidence predictions placed large wagers. When the 49ers won 34-31, those bettors faced steep losses. A calibrated model, by contrast, might have assigned only a 55% win probability, signaling that the -200 odds offered poor value.
Here’s the harsh reality: odds matter more than win percentages. For instance, a 60% success rate at -200 odds (risking $200 to win $100) leads to a net loss. Meanwhile, a 40% success rate at +200 odds (risking $100 to win $200) can yield profit. This stark contrast highlights why identifying value through calibration is far more important than chasing raw accuracy.
Pedro Tabacof - How I lost 1000€ betting on CS:GO with machine learning and Python
The Math Behind Betting ROI: Accuracy Thresholds and Break-Even Points
How Betting Accuracy Affects ROI: Break-Even Thresholds at -110 Odds
How to Calculate ROI: Expected Value Formula
The profitability of a bet hinges on its Expected Value (EV). To calculate EV, use this formula:
EV = (p × (Decimal Odds − 1)) − (1 − p)
Here, p represents the probability of winning, and odds are expressed in decimal format.
Let’s break it down with an example. Suppose you estimate a 60% chance of winning a bet at -110 odds (1.909 in decimal). Plugging the numbers into the formula:
EV = (0.60 × (1.909 − 1)) − (1 − 0.60)
EV = (0.60 × 0.909) − 0.40 ≈ 0.1454
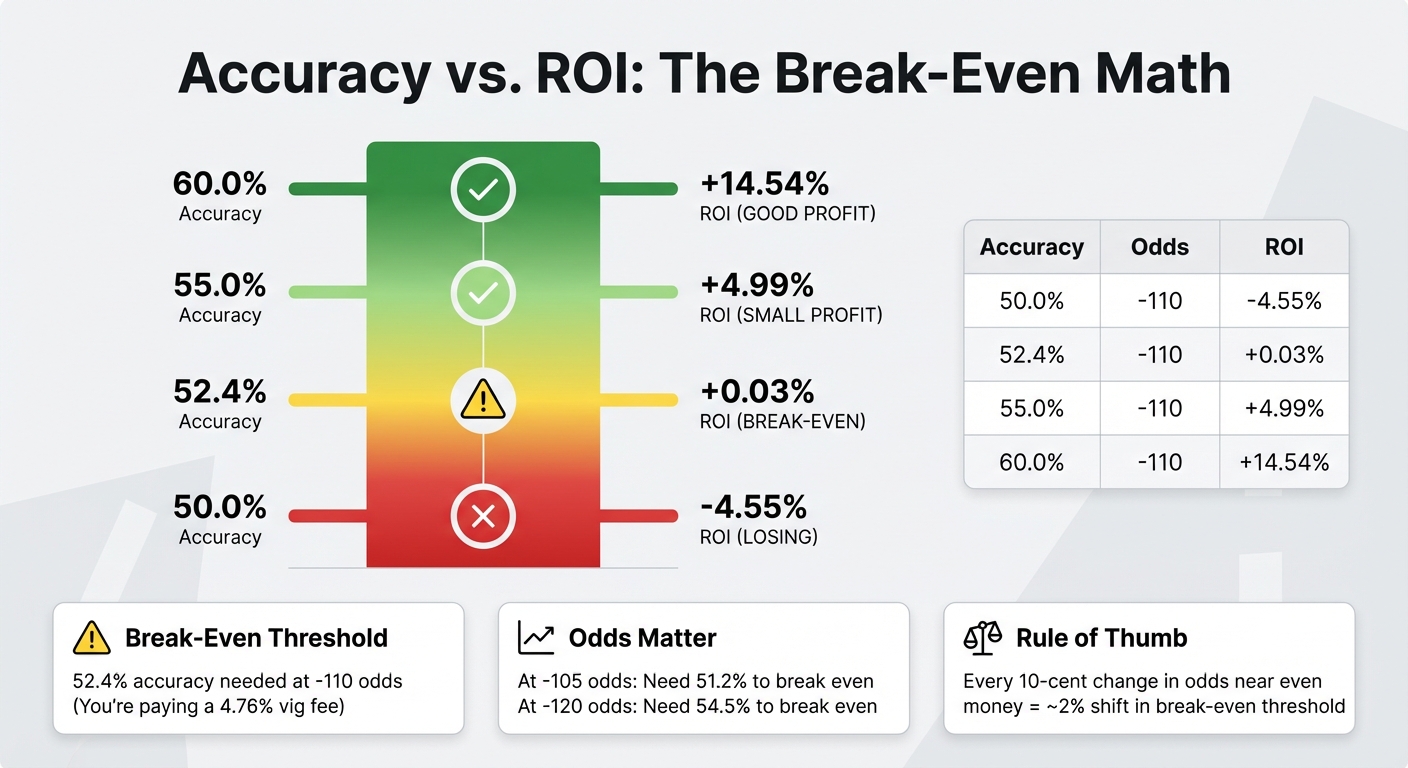
This results in an ROI of +14.54%. On the flip side, if the win probability drops to 50%, the EV becomes −4.55%, indicating a losing bet.
The takeaway? Both win probability and payout odds are critical. Even with a high win rate, poor odds can negate profits. Conversely, favorable odds can turn a modest win rate into a profitable venture. This formula highlights how small shifts in win probability can significantly influence ROI, which ties directly into break-even thresholds.
Accuracy Needed to Break Even
To break even, you need to overcome the sportsbook's built-in margin, often referred to as the "vig." For standard -110 odds, the implied probability is 52.38%. Essentially, this means you’re paying a 4.76% fee with each wager. To offset this, your model must achieve approximately 52.4% accuracy just to break even.
Once you surpass this threshold, your returns begin to grow. For example, at -110 odds:
- 55% accuracy yields an ROI of roughly +4.99%.
- 60% accuracy boosts ROI to about +14.54% .
Even a modest improvement - just 2.6 percentage points above the break-even mark - can significantly increase your returns.
Here’s a quick breakdown:
| Accuracy Level | Odds (American) | Decimal Odds | Expected ROI (%) |
|---|---|---|---|
| 50.0% | -110 | 1.909 | -4.55% |
| 52.4% (Breakeven) | -110 | 1.909 | +0.03% |
| 55.0% | -110 | 1.909 | +4.99% |
| 60.0% | -110 | 1.909 | +14.54% |
The break-even point shifts depending on the odds. For example:
- At -105 odds, you need about 51.2% accuracy to break even.
- At -120 odds, the break-even accuracy jumps to roughly 54.5%.
This highlights why it’s crucial to shop for the best odds. Lower juice reduces the accuracy required to break even, improving your chances of profitability. As a rule of thumb, every 10-cent change in American odds near even money adjusts the break-even threshold by about 2%.
How to Build Calibrated Models for Consistent Profits
Using Brier Score and Log-Loss to Measure Performance
While raw accuracy tells you how often your model picks the correct outcome, it doesn’t reveal whether the probability estimates align with actual results. That’s where calibration metrics come in. Tools like the Brier Score, which measures the mean squared error between predicted probabilities and actual results, and Log-Loss, which penalizes overconfidence in incorrect predictions, provide a deeper understanding of how reliable your model is. This is especially critical when employing aggressive staking strategies like the Kelly Criterion.
Another metric to consider is Expected Calibration Error (ECE). In December 2025, researcher Mostafa Shams analyzed English Premier League betting models (2000–2021) and found some striking results. A Random Forest model with 52.83% accuracy ended up losing $11,049 due to an ECE of 0.11, reflecting an overconfidence of 11 percentage points. Meanwhile, an XGBoost model with a slightly lower accuracy of 51.07% managed to generate a $1,611 profit because it was better calibrated.
"A model that knows it is guessing (and bets small) is infinitely more useful than a model that thinks it is a genius (and bets big)."
– Mostafa Shams, Faculty of Computer and Information, Menoufia University
For smaller datasets, Platt Scaling can help address systematic miscalibrations. On the other hand, for datasets with over 1,000 samples, Isotonic Regression is often more effective.
Using Real-Time Data and Prediction Markets
Incorporating real-time data and prediction markets can help identify discrepancies between your model’s probabilities and market consensus, revealing potential betting opportunities. Prediction markets aggregate the collective judgment of thousands of bettors, creating a baseline for comparison. When your calibrated model’s probabilities differ significantly from this consensus, it could signal an edge worth exploiting.
Real-time game-state variables - like score differential, remaining time, and possession - further enhance your model by allowing it to update win probabilities dynamically. Additionally, monitoring Closing Line Value (CLV) in real time is an excellent way to validate your model. A well-calibrated model often outperforms the closing line by 1%–2%. Techniques like converting betting odds into implied probabilities (adjusted for the bookmaker’s vig), using rolling window validation, and employing grouped folds for cross-validation help ensure your model remains consistent across different seasons. These strategies power tools like WagerProof's Edge Finder, which combines data analysis with real-time market signals.
How WagerProof Identifies Value Bets

Turning calibration metrics and real-time insights into action is where platforms like WagerProof excel. The Edge Finder tool automatically compares your model’s outputs against prediction market spreads to uncover mispriced lines and outliers. By using a multi-model consensus approach that integrates simulations, real-time news analysis, and public money trends, it minimizes individual model biases and enhances calibration.
WagerBot Chat takes this a step further by leveraging professional data sources - like weather updates, odds, injury reports, and model predictions - to validate betting opportunities in real time. When prediction market spreads deviate from expectations, WagerBot sends alerts, even highlighting fade opportunities where public sentiment has skewed odds away from true probabilities.
The platform also keeps tabs on calibration metrics, flagging models for recalibration if their performance starts to drift. This ensures you’re not just blindly following recommendations but actively learning to spot value and manage risks effectively.
Real Examples: Accuracy vs. ROI in NFL and NBA Betting
NFL Point Spreads: High Accuracy, Low ROI Without Calibration
Take the January 2024 NFC Championship between the Detroit Lions and San Francisco 49ers as a case in point. Many accuracy-focused models gave the Lions an 85% win probability, heavily favoring them. But these models were miscalibrated - they overlooked key factors like the 49ers' resilience. Bettors, trusting these inflated probabilities, placed large wagers at -200 odds, expecting a straightforward Lions victory. In reality, the Lions' true win probability was closer to 55%, which aligns with odds around +110.
When the 49ers secured a 34-31 win, the fallout was significant. Bettors who relied on these misaligned predictions faced major losses. This scenario highlights a broader issue: roughly 70% of bets where the calculated "value" exceeds 150% tend to lose. Such patterns often reveal model miscalibration rather than an actual edge in the market. While the NFL example underscores the pitfalls of overbetting on inflated probabilities, NBA betting offers a contrasting story of success through calibration.
NBA Betting: How Calibrated Models Increased ROI
In June 2024, researchers Conor Walsh and Alok Joshi from the University of Bath published a study in Machine Learning with Applications, analyzing a full NBA season. They compared models optimized for raw accuracy against those refined for calibration.
The results were eye-opening: accuracy-based models yielded a -35.17% ROI, while calibration-based models delivered a +34.69% ROI, with the best-performing scenario reaching +36.93%. The study emphasized that Kelly betting only works with a well-calibrated model. When predictions were properly aligned with actual outcomes, bettors could size their stakes wisely, avoiding the bankroll drain caused by overly confident bets.
This stark contrast - a nearly 70 percentage point swing in ROI - drives home a key takeaway: calibration, not just accuracy, is crucial for profitability. Tools like WagerProof's Edge Finder leverage this insight, comparing model predictions against market spreads to uncover mispriced lines where calibrated probabilities point to real value.
Conclusion
Hitting a high accuracy rate doesn’t guarantee profits. Even with a 70% win rate, overconfidence in your stakes can lead to losses. The real game-changer lies in calibration - ensuring your predicted probabilities align with actual outcomes. For instance, if your model predicts a 60% chance for a team to win, that team should win roughly 60% of the time.
Calibration can drive a 31 percentage point improvement in ROI compared to accuracy-focused strategies. This stark difference highlights the importance of aligning your bets with true probabilities rather than perceived accuracy. When you understand your genuine edge, you can confidently bet on real value. Consider this: sportsbooks achieved a 9.3% win rate on nearly $150 billion in wagers in 2024, while only 2% to 3% of bettors managed to stay profitable annually.
Without proper calibration, even the most accurate models can result in losses. Tools like WagerProof's Edge Finder tackle this issue by comparing predictions from multiple models against market spreads. This approach identifies mispriced lines where calibrated probabilities expose genuine value. By using a multi-model consensus, WagerProof pinpoints those rare opportunities where your advantage is real, not a product of miscalculation.
Consistent profits don’t come from predicting more winners - they come from knowing which predictions to trust and adjusting your bet sizes accordingly. Proper calibration turns even small advantages into sustainable returns.
FAQs
How do I tell if my model is calibrated?
To determine if your model is well-calibrated, compare its predicted probabilities with actual outcomes over time. Reliability plots are a helpful visual tool to check if predictions match observed frequencies. You can also use metrics like the Brier Score or Expected Calibration Error (ECE) to quantify calibration. In these metrics, lower scores indicate better alignment between predictions and real-world results. Regularly reviewing and fine-tuning your model helps maintain accurate probability estimates, which is especially important for improving reliability in sports betting.
What odds make a bet +EV with my win probability?
When a bet has a positive expected value (+EV), it means your chances of winning are better than what the odds imply. Put simply, the actual likelihood of success must be greater than what the odds reflect, giving you a profitable advantage.
How should I size bets if my probabilities might be wrong?
If there's a chance your probability estimates are off, it's wise to size your bets cautiously to minimize risk. Make it a habit to regularly fine-tune your model so that your predictions align more closely with actual results, improving their reliability over time. The Kelly Criterion is a well-known method for determining optimal bet sizes, but if you're unsure, consider using a fractional Kelly approach. This can help limit potential losses while still leveraging the strategy. Tools like WagerProof can also be useful for spotting value bets and refining your approach to account for possible errors in your probability assessments.
Related Blog Posts
Ready to bet smarter?
WagerProof uses real data and advanced analytics to help you make informed betting decisions. Get access to professional-grade predictions for NFL, College Football, and more.
Get Started Free