
Poisson Distribution in Sports Betting
Ever wondered how math can improve your sports betting? The Poisson distribution is a simple statistical tool that helps predict match outcomes using historical scoring data. By calculating the likelihood of different scores, bettors can identify value bets - odds where potential payouts exceed the statistical risk. While it’s not perfect (it assumes goals occur independently and ignores real-world factors like injuries), it’s highly effective for low-scoring sports like soccer. Tools like WagerProof combine Poisson models with live data, making betting decisions faster and more accurate.
Key Takeaways:
- Poisson calculates the probability of specific scores based on average scoring rates.
- It’s great for markets like Correct Score, Over/Under, and Both Teams to Score.
- To find value bets, compare your calculated odds with bookmaker odds.
- Combine Poisson with real-time data for better accuracy.
Want to bet smarter? Start with the numbers.
Poisson Distribution Formula and Core Concepts
Breaking Down the Poisson Formula
The Poisson formula is a powerful tool for predicting probabilities, particularly in sports analytics. The formula is expressed as:
P(x; λ) = (e^(-λ) × λ^x) / x!
Here’s a quick breakdown of its components:
- P(x): The probability of a specific outcome, like a certain number of goals.
- λ (lambda): The expected number of goals, calculated using averages from team and league data.
- e: Euler’s number, a mathematical constant approximately equal to 2.718.
- x: The exact number of occurrences being evaluated - like 0, 1, or 2 goals.
- x! (x factorial): The factorial of x. For example, 3! equals 6 (3 × 2 × 1).
This formula takes λ and converts it into a probability distribution for every possible outcome. For instance, Smarkets applied this model to a Premier League match in February 2017, using data from the 2015/16 season. They calculated a λ of 2.016 for Tottenham, predicting a 14.09% probability for a 2–0 victory. This closely aligned with market odds of 14.97%.
Next, let’s explore how λ is determined in the context of sports betting.
Key Variables in the Sports Betting Context
While the Poisson formula itself doesn’t change, the value of λ - critical for predictions - is based on three main factors: home team attack strength, away team defense strength, and the league’s average home goals .
- Attack Strength: This measures how effectively a team scores compared to the league average. It’s calculated by dividing a team’s average goals scored by the league average. A value above 1.0 means the team scores more than the league average .
- Defense Strength: This evaluates how well a team defends, calculated by dividing the average goals a team concedes by the league average. A value below 1.0 indicates a stronger-than-average defense .
For example, in April 2014, researcher Rommel Bartolome analyzed a Premier League match between Southampton and Everton using data from the 2012–13 season. The league averages were 1.558 home goals and 1.239 away goals. Southampton’s home attack strength was calculated at 87.84%, while Everton’s away defense strength was 77.70%. This resulted in a predicted λ of 1.063 goals for Southampton and 1.180 for Everton. The model’s predicted probabilities - 32.7% for a home win, 28.7% for a draw, and 38.6% for an away win - closely mirrored SBObet’s normalized market odds, differing by just 0.1%.
Using Poisson distribution to predict football matches
How to Use Poisson for Score Predictions
How to Calculate Poisson Distribution for Sports Betting: Step-by-Step Guide
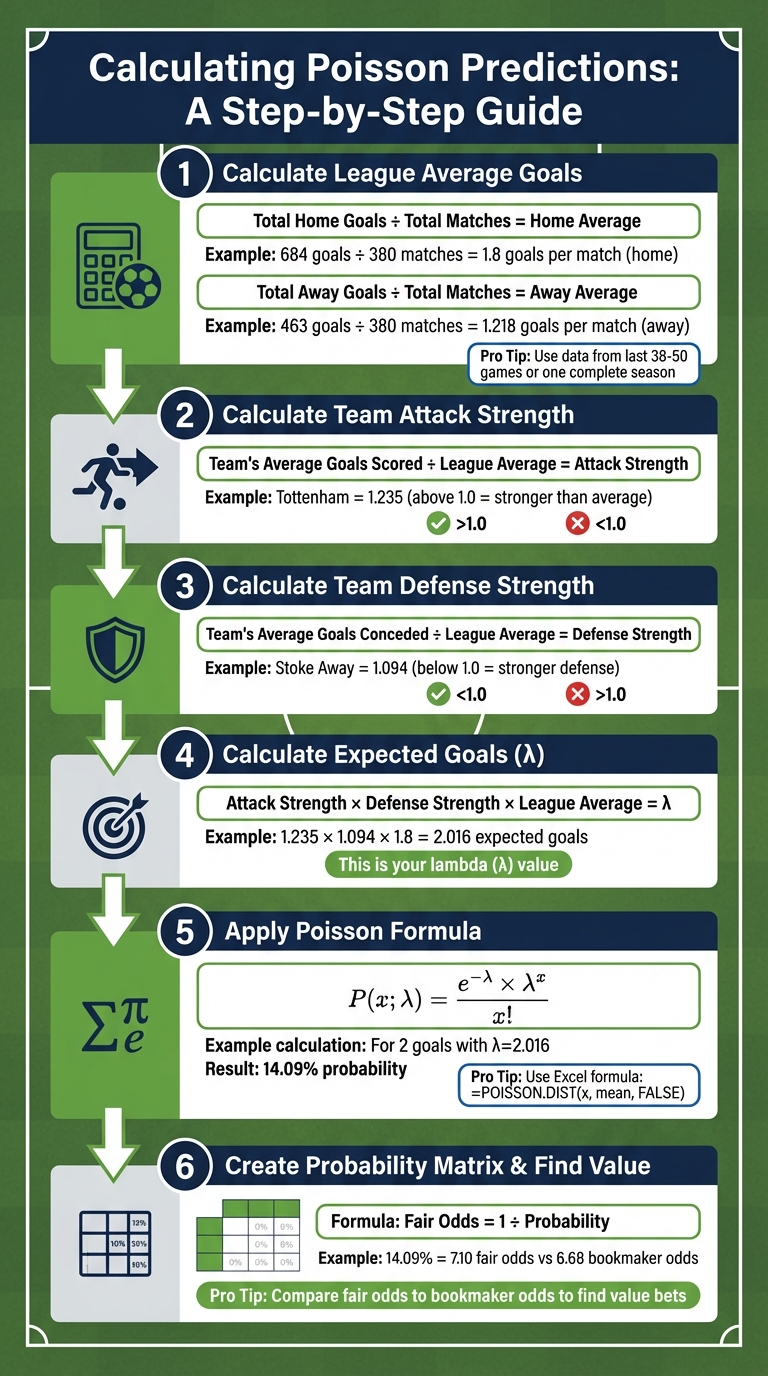
Calculating League Average Goals
Start by working out the league's average goals for both home and away matches. For example, during the 2022/23 English Premier League season, analysts calculated the home goal average by dividing 684 total home goals by 380 matches, which gave an average of 1.8 goals per match. Similarly, dividing 463 total away goals by 380 matches resulted in an away average of 1.218 goals per match.
To keep your predictions relevant and accurate, use data from a recent, complete season or the last 38–50 games. This ensures a good balance between current trends and data reliability. Make it a habit to update your league averages weekly throughout the season so your model reflects any shifts in scoring patterns.
Calculating Team Attack and Defense Strength
With league averages in hand, you can now assess how each team stacks up against the baseline.
- Attack strength measures how effectively a team scores compared to the league average. To calculate it, divide a team's average goals scored by the league's average. A result above 1.0 means the team scores more goals than the league average.
- Defense strength evaluates a team's ability to prevent goals. This is done by dividing the average goals a team concedes by the league average. A value below 1.0 suggests the team has a stronger-than-average defense.
For instance, in February 2017, Tottenham's home attack strength was calculated as 1.235, while Stoke's away defense strength was 1.094 based on 2015/16 data. Multiplying these values by the league's home goal average produced Tottenham's expected goal value (λ = 2.016).
Keep in mind, home and away metrics should be calculated separately for accuracy. If you're automating calculations, Excel's =POISSON.DIST(x, mean, FALSE) formula can help you quickly generate probabilities for specific scorelines.
Creating a Probability Matrix
Once you have the expected goals (λ) for each team, you can create a probability matrix to visualize potential outcomes. Use the Poisson formula to calculate the likelihood of each team scoring a specific number of goals (e.g., 0–5). Then, construct a grid where one team's probabilities are listed horizontally and the other's vertically.
Each cell in the matrix corresponds to a particular scoreline. To calculate the probability for a specific scoreline, multiply the home team's probability of scoring x goals by the away team's probability of scoring y goals. For example, in a Tottenham vs. Stoke match, the model predicted a 14.09% probability for a 2-0 Tottenham win (27.07% × 52.05%). This closely aligned with Smarkets exchange odds of 6.68, which implied a 14.97% probability.
To determine match outcomes, sum up specific sections of the matrix:
- Diagonal cells represent draws.
- Cells above the diagonal indicate away wins.
- Cells below the diagonal signify home wins.
Finally, compare the "fair odds" derived from the matrix (calculated as 1 / probability) with bookmaker odds to identify potential value bets.
Converting Poisson Probabilities into Betting Odds
Converting Probabilities to Betting Odds
To turn probabilities into decimal odds, simply divide 1 by each probability. For example, a probability of 72.69% translates into fair odds of 1.38.
This method applies across different bet types like moneyline, totals, and BTTS (Both Teams to Score). For moneyline (1X2) bets, calculate the total probability for home wins, draws, or away wins from your matrix, and then convert each combined probability into odds. For totals (Over/Under) bets, sum the probabilities for all scorelines on the relevant side of the goal threshold. For instance, for Under 2.5 goals, add the probabilities for scorelines such as 0-0, 1-0, 0-1, 1-1, 2-0, and 0-2. For BTTS, focus on all scenarios where both teams score at least one goal.
Here’s an example: During the 2013/14 Premier League season, Arsenal's model calculated a 53.11% probability for Under 2.5 goals, yielding fair odds of 1.88. In a February 2017 match between Tottenham and Stoke, the Poisson model gave a 14.09% probability to a 2-0 scoreline, resulting in fair odds of 7.10. Interestingly, this was close to Smarkets' exchange odds of 6.68, which implied a 14.97% probability.
Once you’ve calculated these fair odds, the next step is to hunt for discrepancies that signal potential value bets.
Finding Value Bets with Poisson Analysis
Value bets arise when the bookmaker’s odds are higher than your calculated fair odds. For example, if your model suggests fair odds of 1.82 for a home win but the bookmaker offers 2.10, you’ve identified a potential positive expected value opportunity.
Keep in mind that bookmakers include a margin (overround) in their odds, typically ranging from 5% to 20%. To accurately spot value, you’ll need to account for this margin - either by adjusting the bookmaker’s odds or by adding a similar margin to your Poisson-derived odds for a fair comparison.
To streamline this process, tools like WagerProof can be invaluable. These platforms automatically compare your model’s fair odds with live bookmaker prices, highlighting value opportunities in real time. This spares you the effort of manually analyzing multiple markets and ensures you can act quickly when a value bet emerges.
Using Poisson with Real-Time Data Platforms like WagerProof

Using WagerProof's Real-Time Data
Poisson models are excellent for generating statistical predictions, but they rely heavily on historical averages, often overlooking real-time variables like injuries, weather, or tactical changes. This is where platforms like WagerProof step in to bridge the gap. By incorporating live data - such as betting trends, public money flow, and prediction market insights - into your Poisson calculations, you can update the key parameter, λ, to reflect current conditions.
For instance, imagine a star striker is ruled out just an hour before a match. With WagerProof's real-time data, you can quickly adjust your team's attacking strength to account for the absence. Similarly, tracking shifts in bookmaker odds can highlight deviations from initial statistical expectations, providing valuable insights.
"By analyzing the odds that have been adjusted in real-time, one can identify which bets have become skewed, indicating a shift from the initial probability calculation, often driven by public sentiment or insider information." - Rory Garton-Smith
WagerProof also offers access to expected goals (xG) data, which is more precise than using raw historical goal counts in your Poisson formula. Models that incorporate high-quality xG data have demonstrated 70–80% accuracy in predicting exact scores for top-tier soccer leagues.
Automating Value Bet Detection with WagerProof
Manually comparing Poisson-derived probabilities to bookmaker odds can be time-consuming and error-prone. WagerProof’s Edge Finder simplifies this process by instantly calculating the difference (delta) between your model's fair odds and live market prices. A larger delta signals a stronger betting opportunity, and the platform flags these mismatches in real time, allowing you to act quickly.
The effectiveness of these automated adjustments is backed by experts. Chris Allen, a sports and matched betting expert at ProfitDuel, highlights:
"Over hundreds of prop markets I've tracked, pairing historical averages with a Poisson calculator routinely flags lines mispriced by 2–4%. Acting only when that edge appears has been the single biggest driver of long-term profit preservation in my bankroll."
WagerProof’s automated alerts can surface these opportunities across multiple markets simultaneously, saving time and increasing efficiency.
At the same time, the platform helps you avoid chasing false edges. Casey Halpern, another sports betting expert at ProfitDuel, cautions:
"When bettors feed shaky averages into Poisson models, probability swings by double digits and the false edge evaporates."
To counter this, WagerProof integrates critical data like injury updates, pace adjustments, and sample size validation, ensuring your inputs remain reliable. This reduces the risk of acting on misleading values and helps maintain a disciplined approach to betting.
Pros and Cons of Using Poisson in Betting
Pros: Accuracy and Transparency
The Poisson model is a powerful tool for generating objective predictions based on historical scoring data. Its calculations are fully transparent, showing exactly how probabilities are determined. This makes it easy to replicate the process for any match.
One of its key strengths is identifying value by comparing calculated fair odds against market odds. Even better, the model can produce predictions across multiple betting markets - such as Correct Score, Over/Under, Both Teams to Score, and Match Result - all from a single calculation. For sports with lower scoring rates like soccer, hockey, and baseball, where goals or points occur in small, independent increments, Poisson models can achieve 70-80% accuracy for exact scores when using high-quality expected goals (xG) data.
Paul Costanzo, a sportsbook expert at Sports Betting Dime, highlights the importance of mastering statistical tools like Poisson:
"While even the most effective use of statistical analysis tools (like a Poisson distribution)... don't necessarily guarantee you a win, developing a mastery of such tools can definitely have a dramatic impact on your ability to find value."
Cons: Assumptions and Real-World Complexity
Despite its advantages, the Poisson model has its limitations. Its accuracy depends on key assumptions that don’t always align with the unpredictable nature of real matches. For instance, Poisson assumes goals occur independently and at a constant rate, but in reality, matches are far more dynamic. A team that scores early might adopt defensive tactics, or unexpected events like red cards can completely alter the flow of play - factors the model doesn’t account for. Additionally, the model relies heavily on historical averages, which can quickly become outdated after significant changes like managerial shifts, player transfers, or injuries.
The model also overlooks critical human factors such as player fatigue, weather conditions, or injuries, which can significantly disrupt scoring patterns. It treats all outcomes equally, failing to distinguish between a lucky 1-0 win and a dominant performance, as it focuses solely on final scores rather than the match’s flow. Furthermore, basic Poisson models often underestimate the likelihood of draws, especially goalless ones like 0-0 outcomes.
As SBO.net aptly points out:
"The model is objective, which means it does not take into account other factors... like injuries, suspensions, fatigue or weather."
To address these shortcomings, it’s crucial to combine Poisson analysis with real-time data. Platforms like WagerProof enhance the Poisson model by integrating live updates, such as injury reports, pace changes, and market trends, into the betting framework. This approach helps bridge the gap between theoretical predictions and the complexities of live matches, making the model more effective in practice.
Conclusion
The Poisson distribution gives sports bettors a structured way to turn historical scoring data into meaningful probabilities. By calculating a team's attack and defense strengths and applying the Poisson formula, you can estimate fair odds for match outcomes, correct scores, and over/under markets. What makes this approach valuable is its ability to pinpoint value bets - those moments when your calculated probabilities suggest better odds than the bookmaker's lines.
That said, the Poisson model isn't flawless. It assumes goals happen independently and at a steady rate, which means it doesn’t account for real-life factors like tactical changes, red cards, injuries, or even weather. On top of that, manually crunching numbers can be slow, especially if you're trying to analyze a large volume of games.
This is where automation steps in to make life easier. Tools like WagerProof take theoretical models like Poisson and adapt them for the fast-paced world of live betting. By incorporating real-time data - such as injury reports, pace shifts, and market trends - these platforms bring speed and scale to the table. Features like the Edge Finder flag potential value bets by comparing your calculated probabilities with live odds, while WagerBot Chat offers actionable insights based on data. This combination of automation and real-time updates creates a more efficient and balanced betting strategy.
To maximize your edge, pair these tools with some manual fine-tuning. Use xG (expected goals) data instead of basic goal averages, break down stats by home and away performance, and give more weight to recent games to capture current form. Finally, stick to smart bankroll management - keeping individual bets to 1–3% of your total bankroll can help you handle the ups and downs that come with any probability-based system.
FAQs
How can the Poisson distribution help me find value bets in sports betting?
The Poisson distribution is a handy method for predicting scores and spotting value bets, particularly in low-scoring sports like soccer, hockey, and baseball. By diving into historical data, you can uncover patterns in how teams score and use that information to estimate the chances of specific outcomes - like exact scores or total goals.
To start, collect recent data on the teams you're analyzing. Calculate their offensive and defensive strengths to estimate the expected number of goals for each team. Once you have these figures, plug them into the Poisson formula to calculate the probability of different outcomes. From there, translate these probabilities into implied odds and compare them to the odds offered by sportsbooks. If your calculations show a bet has a positive expected value (EV), you’ve found a potential value bet.
WagerProof makes this process easier by offering tools like historical stats, a built-in Poisson calculator, and real-time odds feeds. These resources can help you quickly identify mismatches and value opportunities, allowing you to make more informed, data-driven betting decisions.
What are the challenges of using the Poisson distribution to predict sports outcomes?
The Poisson distribution operates on the idea that scoring events are rare, independent, and occur at a steady average rate. However, this often clashes with the unpredictable nature of actual sports games. For instance, a single goal can completely alter a team’s approach - whether it's tightening up defensively to protect a lead or pushing forward aggressively to catch up. These dynamic shifts are beyond what the Poisson model can handle. On top of that, it doesn’t factor in real-time elements like weather conditions, injuries, tactical adjustments, or even the psychological momentum of a game.
The reliability of Poisson predictions also hinges on the quality of the input data. Historical stats need to come from games with comparable conditions, such as similar team lineups and circumstances. Using mismatched data - like games from different tournaments or periods when rosters underwent major changes - can lead to skewed results. Add to that the impact of home-field advantage, shifts in team form over time, and varying playing styles, and the complexity of accurate predictions increases significantly.
This model is particularly suited for low-scoring sports like soccer, hockey, or baseball, where its assumptions hold up reasonably well. But in high-scoring games like basketball, the model struggles, and its predictions lose accuracy. While Poisson can serve as a solid foundational tool, blending it with other statistical approaches or expert analysis often yields more reliable outcomes.
How does using real-time data enhance the accuracy of Poisson models in sports betting?
Real-time data keeps Poisson models sharp by integrating the latest match details, team stats, and betting patterns. This ensures predictions account for current factors like shifting game momentum or sudden player substitutions, resulting in more precise probability estimates.
By constantly updating expected goal rates and other crucial variables, real-time data equips bettors with the most up-to-date insights, helping them make more informed decisions.
Related Blog Posts
Ready to bet smarter?
WagerProof uses real data and advanced analytics to help you make informed betting decisions. Get access to professional-grade predictions for NFL, College Football, and more.
Get Started Free