
Prediction Markets: Exploit Line Movement
Prediction markets let you trade outcome-based contracts directly with other users, reflecting real-time probabilities. A key strategy is analyzing line movement - shifts in odds caused by factors like sharp money, injuries, or public betting. For example, "reverse line movement" (RLM) occurs when odds shift against public betting trends, often signaling professional action.
Key takeaways:
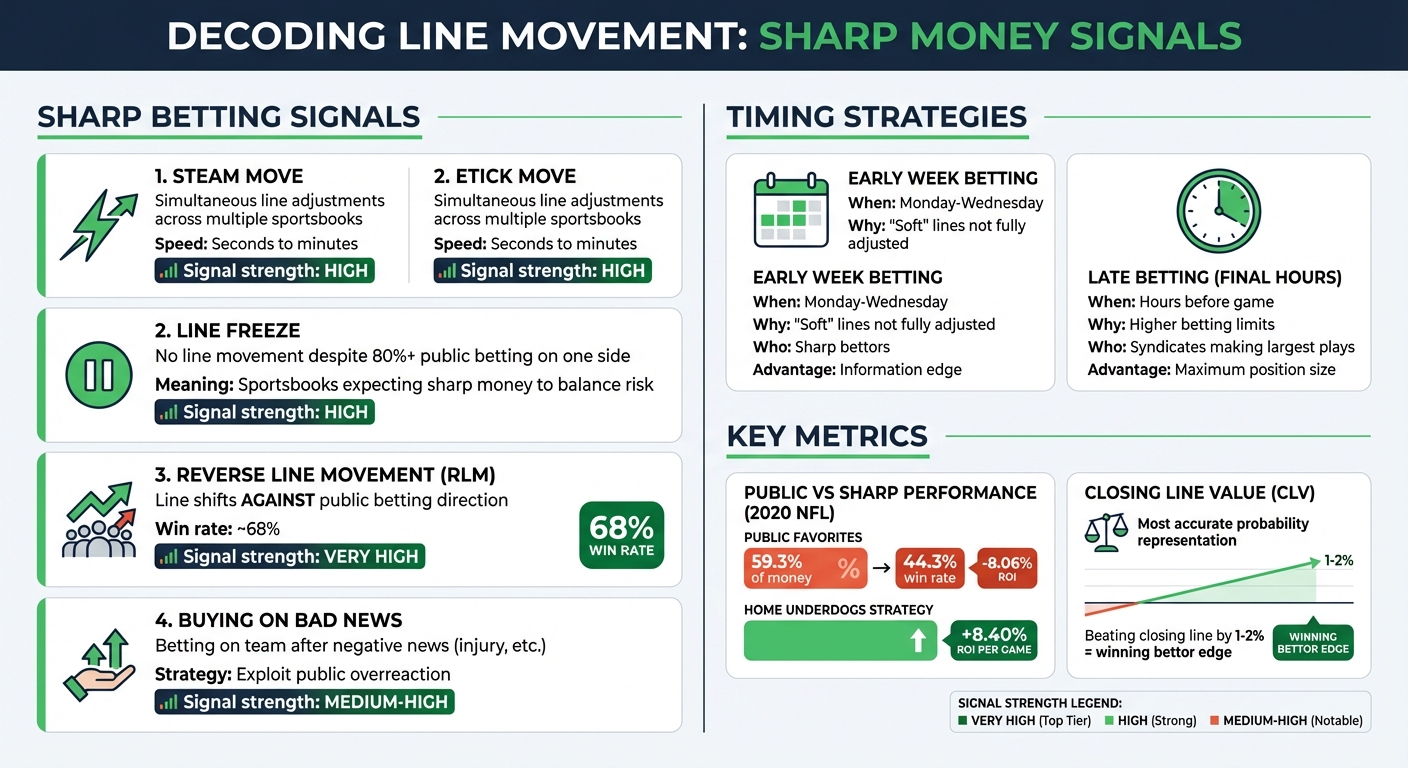
- Line movement reveals informed betting patterns, such as steam moves (rapid shifts) or line freezes (no change despite heavy public betting).
- Sharp bettors exploit overreactions, often betting early on "soft" lines or late when limits increase.
- Tools like WagerProof track live odds, highlight mismatches, and provide alerts for potential value bets.
5 Sneaky Ways to Exploit Line Movement (and Make Money!)
How Line Movement Reveals Opposition Betting Patterns
Line Movement Signals: Sharp vs Public Betting Patterns
Line movements can be a window into where the sharp money is going. When professional syndicates and experienced bettors spot value, their coordinated actions create noticeable patterns that reflect their strategies. By recognizing these signals, you can align yourself with the informed money rather than opposing it. Let’s break down how to identify these strategic shifts.
Spotting Strategy Changes in Line Shifts
One of the clearest indicators of professional betting activity is the steam move. This happens when sportsbooks adjust their lines almost simultaneously and very quickly - often within seconds or minutes. It’s a sign that sharp bettors are acting in unison before the market has time to catch up. Unlike the slower, more gradual shifts caused by casual bettors, steam moves are rapid and deliberate.
Another key signal is the line freeze. Imagine 80% of public bets are on one side of a game, yet the line doesn’t budge. This often means sportsbooks are holding steady, expecting sharp money to come in and balance their risk. In essence, it’s a standoff between the public and professional bettors, revealing where the pros see things differently.
Sharp bettors also use a tactic known as buying on bad news. For instance, when a star player is ruled out, recreational bettors tend to overreact and bet heavily on the other team. If the line moves beyond what the player’s actual value justifies, professionals step in and back the "bad news" team. This strategy takes advantage of emotional overreactions from the public.
Real Examples of Line Movement Exploitation
Studies tracking reverse line movement have consistently shown that professional money outperforms public bets. These patterns highlight how sharp bettors systematically exploit market inefficiencies.
Timing is another critical factor. Sharp bettors often place their bets early in the week, while lines are still "soft" and haven’t fully adjusted to all available information. On the flip side, significant line movement in the final hours before a game usually signals that syndicates are making their largest plays, taking advantage of higher betting limits. Paying attention to when a line moves can be just as revealing as the movement itself.
Research on Exploiting Prediction Market Data
What Studies Show About Line Movement
Studies suggest that betting markets often overreact, creating opportunities for savvy bettors to exploit mispriced lines.
Jay Simon from American University conducted a study on 3,681 MLB games across sportsbooks like Caesars, DraftKings, FanDuel, and PointsBet from 2019 to 2022. His research revealed:
"There is sufficient evidence to reject weak form market efficiency; specifically, betting lines tend to overreact, exhibiting significant negatively autocorrelated changes that could be exploited by sophisticated bettors."
In simpler terms, when betting lines move sharply, they tend to overcorrect before settling closer to true probabilities. This creates a brief window where bettors can find value by going against the overreaction.
Another study focusing on NFL betting patterns found that games with lower visibility experience more dramatic line shifts. These include matchups with smaller TV audiences or non-prime-time kickoffs. The reason? Oddsmakers prioritize high-profile games, leaving smaller contests with less precise lines. Given that nearly 50% of U.S. sports bets involve the NFL, sportsbooks focus their sharpest efforts on games with the largest betting volume.
Interestingly, research on MLB weekend day games uncovered a counterintuitive trend: lines closer to game time were less accurate than those recorded 90 minutes before the first pitch. This challenges the assumption that more time and information always lead to better predictions.
These findings highlight how market inefficiencies can be identified and exploited, especially by those who act quickly on real-time data.
How Data Helps Predict Odds Changes
These insights underscore the value of using data to anticipate market movements before corrections occur.
Real-time market data allows bettors to capitalize on overreactions. When lines shift too far in one direction (a phenomenon known as negative autocorrelation), there’s often an opportunity to bet the opposite side before the market corrects itself. This pattern is evident across both MLB and NFL betting.
For instance, public bettors often distort lines. During the 2020 NFL season, 59.3% of public money was placed on favorites, yet those favorites only covered 44.3% of the time. A simple strategy targeting home underdogs that season could have yielded an average return of 8.40% per game, compared to the public’s negative return of -8.06%.
Timing and visibility are critical factors. Sharp bettors focus on low-visibility games where sportsbooks dedicate fewer resources, and they take advantage of moments when the market overreacts to early betting activity. With access to data-driven sports betting analytics and real-time line movement data, you can identify these patterns and act before the market adjusts, giving you a significant edge.
How WagerProof Helps Track and Exploit Line Movement

Live Line Tracking and Automated Alerts
WagerProof keeps an eye on prediction market data in real time, flagging mismatches in spreads between different sources. If the platform spots a gap between prediction market odds and sportsbook lines, it sends you an alert about a potential value bet. This gives you a chance to act quickly, potentially before the market adjusts.
The Edge Finder tool is another key feature. It compares statistical models to current market odds, highlighting outliers when odds discrepancies appear. By flagging mismatches between consensus models and betting lines, it helps you spot opportunities to capitalize on opposing betting trends before they disappear.
Fade Signals and Opposition Strategy Detection
WagerProof uses Public Money Splits to reveal the percentage of tickets versus the percentage of money on either side of a bet. When there’s a big gap between the number of tickets and the money wagered, it could mean sharp bettors are betting against the public. WagerProof’s fade signals automatically detect these situations, alerting you when going against the crowd might be a smart move.
The platform also features an AI Game Simulator, which runs thousands of win probability simulations for each game. If the simulation results differ significantly from market odds, it points to a potential opportunity. These insights are designed to help you make smarter, data-driven decisions.
Data Transparency and Informed Decisions
WagerProof doesn’t just highlight market inefficiencies - it also provides the context you need to act on them. Through WagerBot Chat, you’ll get live updates on everything from weather and injuries to odds and historical stats, all explained in straightforward terms. This ensures you’re making decisions based on the same high-level data professionals use - not just following a random pick.
The Model Aggregator is another valuable tool, combining 50 statistical models through z-score standardization to give you a clear view of market consensus. By providing this level of transparency, WagerProof helps you separate real betting opportunities from random market movements, boosting your confidence when acting on line changes.
Conclusion: Use Prediction Markets to Find Betting Edges
Prediction market data offers a clear lens into where sharp money is flowing and when public betting creates opportunities on the other side. One powerful indicator is reverse line movement - when the betting line shifts against the majority of public bets. This often signals professional bettors taking a position and has shown a win rate of about 68%.
Another key metric is the closing line, which reflects the market's most accurate probability after absorbing all available information. Beating the closing line by even a small margin - 1–2% - is what sets winning bettors apart. Tracking your Closing Line Value (CLV) is essential to see if you're consistently securing better odds than the final market price. As LoserWins explains:
"The closing line is generally considered the most accurate representation of true probability. It's been tested by the market."
Tools like WagerProof simplify this level of analysis. Automated alerts highlight mismatches in spreads, public money splits reveal when sharp bettors are opposing the crowd, and the Model Aggregator pinpoints moments when 50 statistical models agree the market has mispriced a game. These features give you access to professional-grade data and insights, trusted by experienced bettors.
FAQs
How can I tell if a line move is sharp money or just public hype?
To figure out if a line movement is caused by sharp money or just public hype, keep an eye out for reverse line movement. This happens when the betting line moves in the opposite direction of where most public bets are going - often a sign that professional bettors are impacting the market.
Another clue is the comparison between the percentage of bets and the amount of money wagered. If a small percentage of bets accounts for a large portion of the money, it’s likely sharp action at play. Pros tend to make fewer, but much larger and more calculated, wagers.
When is the best time to bet to capture line value (early vs late)?
The ideal moment to take advantage of line value is as early as possible - before sharp bettors and market adjustments influence the odds. Acting quickly allows you to capitalize on initial pricing inefficiencies and secure better lines. Betting early can give you an edge by locking in favorable odds before the market settles.
How do I track Closing Line Value (CLV) and know if it’s real edge?
To measure Closing Line Value (CLV) and determine if it represents a genuine edge, compare the odds you locked in with the final market odds right before the event begins. If you consistently outperform the closing line, it’s a strong indication that you’re capturing positive expected value.
Keeping an eye on how lines shift over time and across different markets can further confirm whether your edge is real and sustainable, rather than a result of chance.
Related Blog Posts
Ready to bet smarter?
WagerProof uses real data and advanced analytics to help you make informed betting decisions. Get access to professional-grade predictions for NFL, College Football, and more.
Get Started Free