Public Money Data and Live Betting Edge
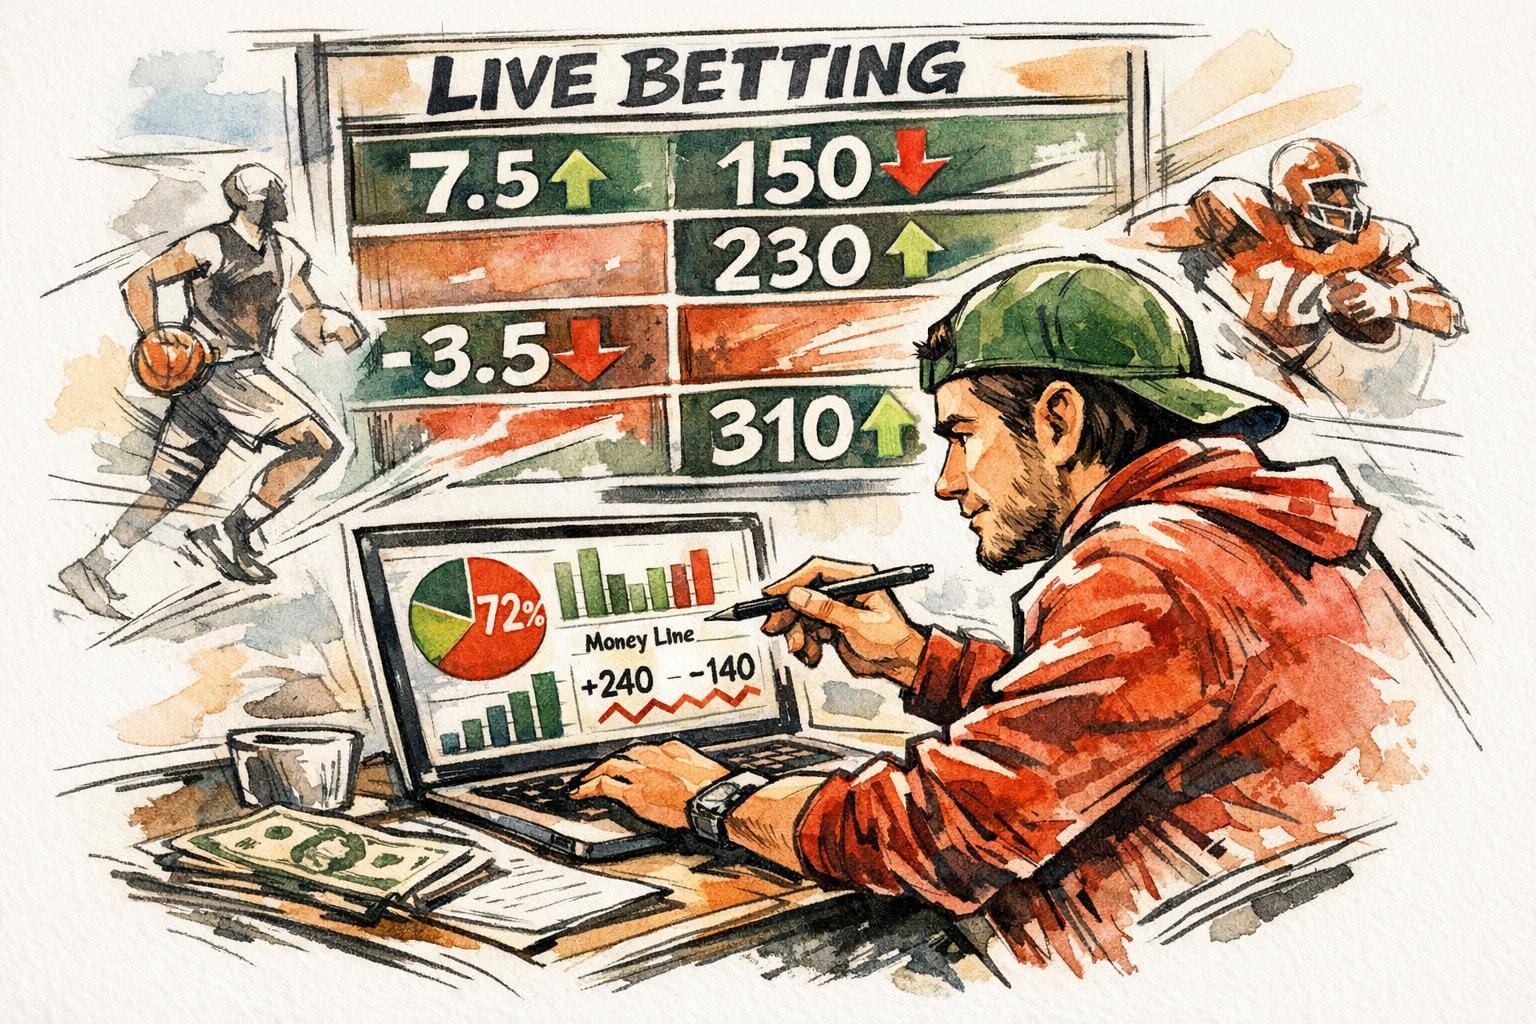
Public money data shows where bets and dollars are flowing in sports betting. It highlights two key metrics: Ticket % (number of bets) and Money % (amount wagered). When these numbers diverge, it often signals sharp action - bets placed by professional gamblers. For example, if 35% of bets account for 50% of the money, it’s a sign that sharp bettors are backing that side.
In live betting, tracking reverse line movement (RLM) - when betting lines shift against public sentiment - can reveal opportunities. For instance, if the public heavily backs a favorite but the line moves toward the underdog, sharp money might be influencing the market. However, interpreting this data can be tricky due to factors like sportsbook differences, small sample sizes, or late public betting.
To use public money data effectively:
- Spot Gaps: Look for a 10%+ difference between Money % and Ticket %.
- Track Live Splits: Monitor real-time shifts to identify sharp action.
- Automate Alerts: Tools like WagerProof can flag RLM or other trends instantly.
Combining public money data with historical trends and statistical models can help refine your strategy. Focus on consistent value, manage your bankroll, and track your results over time to improve your ROI.
How to Read Public Money Data for Live Betting
Ticket % vs. Money %: What the Numbers Mean
Ticket Percentage shows the number of individual wagers placed - it’s a reflection of how many bets are being made on each side. On the other hand, Money Percentage tracks the total dollar amount wagered, which often points to where the larger, professional bets are landing. A noticeable gap between these two percentages can hint at professional betting activity. Josh Applebaum from Casino.org explains it like this:
"If a team has 10 percent or more money than tickets, it may suggest bigger wagers are concentrated there".
If a side garners 65% or more of the tickets, it’s typically considered the public favorite. Conversely, when 35% or fewer tickets are on a side, it’s seen as a contrarian play. This difference between ticket and money percentages is key to identifying potential value.
The Pro Edge Formula: Money % Minus Ticket %
Here’s a simple way to spot value: subtract the Ticket % from the Money %. If the result is +10% or higher, it often indicates sharp action. For example, if a team has 35% of the tickets but accounts for 48% of the money - a +13% difference - it suggests that while the public may be backing one side, larger, more strategic bets are favoring the other. This is a strong signal of professional interest and is often accompanied by supportive line movement.
The best plays often meet multiple criteria: fading the public (with less than 35% of tickets), showing a significant money-to-ticket gap (10% or more), and experiencing reverse line movement.
Finding Outliers in Live Betting Markets
Taking the pro edge approach further, spotting outliers in live betting markets can sharpen your strategy even more. In live betting, outliers occur when the flow of money significantly diverges from public trends. For example, in totals markets, the public typically prefers the over. But if the under is attracting a much higher share of money compared to its ticket percentage - especially if the line is moving downward - that’s a notable outlier to watch.
Live betting updates these numbers in real time. A situation where high ticket volume contrasts with a lower money percentage often signals sharp action. Tools like WagerProof can instantly flag these discrepancies with automated alerts, allowing you to act on opportunities as they arise.
It’s also important to consider the type of sportsbook providing the data. For instance, DraftKings often reflects broader national betting patterns, while Circa is known for catering to high-stakes professional bettors. By aggregating data from multiple sportsbooks, you can minimize regional biases - like local fans over-betting their home team - and get a clearer picture of where the significant money is flowing.
The Truth About Sharp Money & Steam Chasing | Unscripted with Bill Krackomberger
How to Use Public Money Data in Live Betting
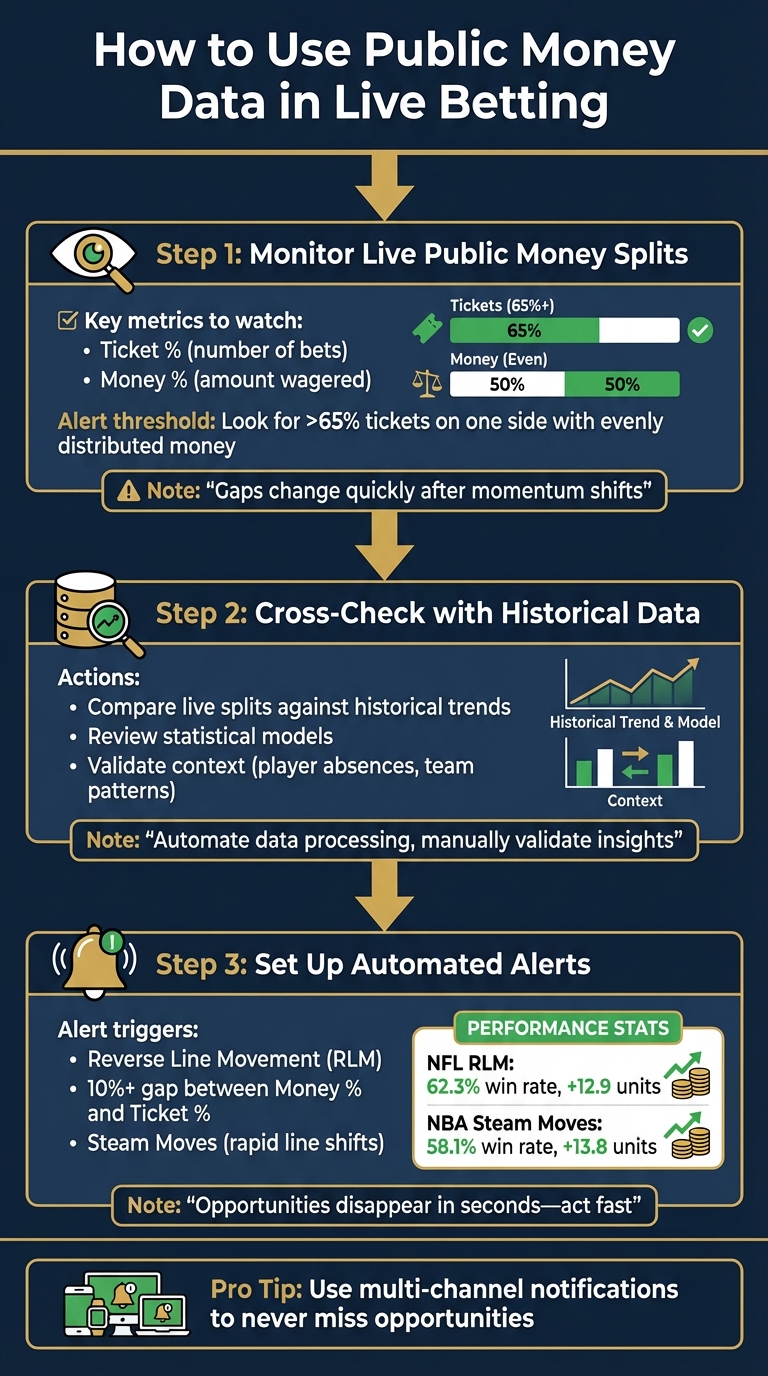
How to Use Public Money Data in Live Betting: 3-Step Strategy
Step 1: Keep an Eye on Live Public Money Splits
Pay attention to live shifts in Ticket % and Money % during a game. If one side has over 65% of the tickets but the money remains evenly distributed, it’s a sign that the public is leaning heavily on that side, while sharp bettors might be favoring the other. These gaps can change quickly, especially after momentum-shifting events like a touchdown or a game-changing scoring run.
These live splits provide the foundation for deeper analysis using historical data and predictive models.
Step 2: Cross-Check with Historical Data and Models
Once you’ve spotted an interesting live money split, compare it against historical trends and your own statistical models. A balanced approach works best here: let automation handle the heavy data processing, but always manually validate the insights. For example, if sharp money is backing the under in an NBA game, dig into past games to see if the team tends to slow down in the second half or if a key player is absent. Always understand the context behind a live shift before placing your bet.
After you’ve confirmed an edge using historical data, set up automated tools to keep track of similar opportunities in real time.
Step 3: Use Automated Alerts for Immediate Action
Live betting opportunities can disappear in seconds, so automated alerts are crucial. Platforms like WagerProof can notify you in real time when specific conditions are met, such as reverse line movement or a 10% discrepancy between money and ticket percentages. Configure alerts for scenarios like Steam Moves - rapid, uniform line shifts - and instances where the money percentage far outweighs the ticket percentage. For example, NFL Reverse Line Movement bets have shown a 62.3% win rate with +12.9 units, while NBA Steam Moves delivered a 58.1% win rate with +13.8 units during the 2025–26 season.
"The Reverse Line Movement strategy is an alert-based feature that is triggered automatically when the betting line (Spread, Moneyline, or O/U) moves in the opposite direction of the betting percentages." – Sports Insights
Set up multi-channel notifications to ensure you don’t miss these fleeting opportunities. As alerts come in, verify the moves and act quickly.
Building Public Money Data into Your Betting Strategy
Using Public Money Data with Statistical Models
Public money data can add an extra layer of confidence to your statistical models. For instance, if your model identifies a value bet with positive expected value (EV+) and public money data reveals reverse line movement - where the line shifts against the majority of public bets - you’ve likely uncovered a strong betting opportunity.
To make the most of this, calculate fair value odds by stripping out the sportsbook's vig, then compare those odds to current betting splits. If the public is overestimating a favorite or a home team, you may notice the line has been artificially inflated. Pay close attention to games where one side has a significantly higher money percentage compared to its ticket percentage. These discrepancies often indicate that larger, professional wagers are backing that side.
Run your models early to identify potential bets, but wait until closer to game time to analyze public money data for more accurate insights. For bet sizing, consider using the Kelly Criterion, which helps optimize your stakes based on win probability and expected return. Combining these steps creates a solid foundation for tracking and improving your return on investment (ROI).
Tracking ROI from Public Money Bets
Once you’ve incorporated public money data into your betting strategy, tracking your results becomes essential. ROI is your ultimate measure of profitability. Keep in mind that professional bettors typically win around 55–60% of their bets. Success comes from consistently identifying value and managing your bankroll effectively.
Keep detailed records of each wager, including the outcome, stake, and the specific public money signal that influenced the bet. Monitor your closing line value (CLV) by comparing the odds of your bet to the final closing line; consistently securing better odds than the closing line is a strong indicator that your strategy is working.
It’s also helpful to break down your results by market type - whether spreads, totals, or moneylines - as public money signals may perform differently across these categories. Use unit-based tracking, where you bet a fixed percentage (usually 1–5%) of your bankroll per wager, to maintain consistency regardless of bankroll size or fluctuations. Tools like WagerProof can simplify this process by automatically tracking key metrics, helping you determine which signals deliver the best ROI.
Regularly review your betting logs to refine your approach. If you notice specific adjustments to your public money thresholds improve your results, tweak your strategy accordingly. And most importantly, stay disciplined - don’t chase losses during a rough patch. Focus on the long-term process, just as professional sharps do.
Conclusion: Making Better Bets with Public Money Data
Grasping the nuances of public money data can give you a real advantage in live betting. The trick lies in telling apart casual public bets from sharp, professional wagers. For instance, a gap of 10% or more between Money % and Ticket % often highlights where the smart money is heading. This knowledge allows for quick, well-informed decisions during live play.
Live betting moves fast, and manual analysis just can’t keep up. Automation, on the other hand, delivers insights instantly. Tools like WagerProof pull real-time data from major sportsbooks such as DraftKings, BetMGM, FanDuel, and Caesars, smoothing out regional inconsistencies to offer a clearer national perspective. Features like the Edge Finder help pinpoint value bets and outliers, while WagerBot Chat lets you ask specific questions about game scenarios and get instant, data-driven answers.
To make the most of these insights, use tools to spot opportunities - like reverse line movements, where heavy public betting goes against a shifting line - and always verify the context before placing your wager. Setting up automated alerts ensures you stay on top of favorable shifts as they happen.
"The consensus was that players found a consensus of action across several sites more accurate and more useful to their decision making." - Evan Kirkham, CEO, Outlier
AI is also reshaping the betting landscape. By combining data analysis with automation, AI-powered tools are reported to improve bet success rates by 15–20% compared to traditional methods. The goal isn’t to win every bet but to consistently find edges and manage your bankroll wisely. You can start with WagerProof's Free Plan to explore the Edge Finder and basic stats, then upgrade to Premium for access to advanced features like the AI Game Simulator, historical analytics, and a private Discord community where you can connect with other data-savvy bettors.
FAQs
How can I spot sharp betting action using public money data?
To spot sharp betting activity, focus on the relationship between the percentage of bets (tickets) and the percentage of money (handle). Pay attention to lopsided splits - situations where a smaller portion of bets corresponds to a much larger share of the money. This often signals that larger, more strategic wagers are being placed by sharp bettors.
Another telltale sign is reverse line movement, which happens when the betting line moves in the opposite direction of where most bets are placed. This shift usually indicates that sharp bettors are putting their money on the less popular side, leveraging their deeper research and analysis.
By keeping an eye on these trends, you can gain valuable insights and make more informed betting choices.
What is reverse line movement, and why does it matter in live betting?
Reverse line movement happens when the betting line shifts in the opposite direction of where the majority of public bets are landing. This often signals that professional or sharp bettors are backing the less popular side. In live betting, this can be a clue to uncover hidden value, as it shows that sharp money is impacting the odds, even when public opinion leans the other way.
Keeping an eye on reverse line movement can give you insight into where the smart money is flowing. This can help you make more informed decisions, especially if the line movement reveals opportunities that aren’t immediately obvious.
How can automation tools help improve my live betting strategy?
Automation tools can take your live betting strategy to the next level by handling massive amounts of data, pinpointing value opportunities in real time, and minimizing the impact of emotional decisions. These tools analyze public money trends as they happen, revealing where the majority is placing bets. They also use predictive models to spot mismatches between sportsbook odds and the actual probabilities, giving you a critical edge.
Features like automated alerts for value bets, precise bankroll management, and real-time updates on public betting splits ensure you can react swiftly and strategically. By taking care of the complex analysis, these tools free you up to focus on sharpening your instincts, ultimately helping you make more informed and profitable betting choices.
Related Blog Posts
Ready to bet smarter?
WagerProof uses real data and advanced analytics to help you make informed betting decisions. Get access to professional-grade predictions for NFL, College Football, and more.
Get Started Free