Public Money Trends: Historical Impact on Betting Edges
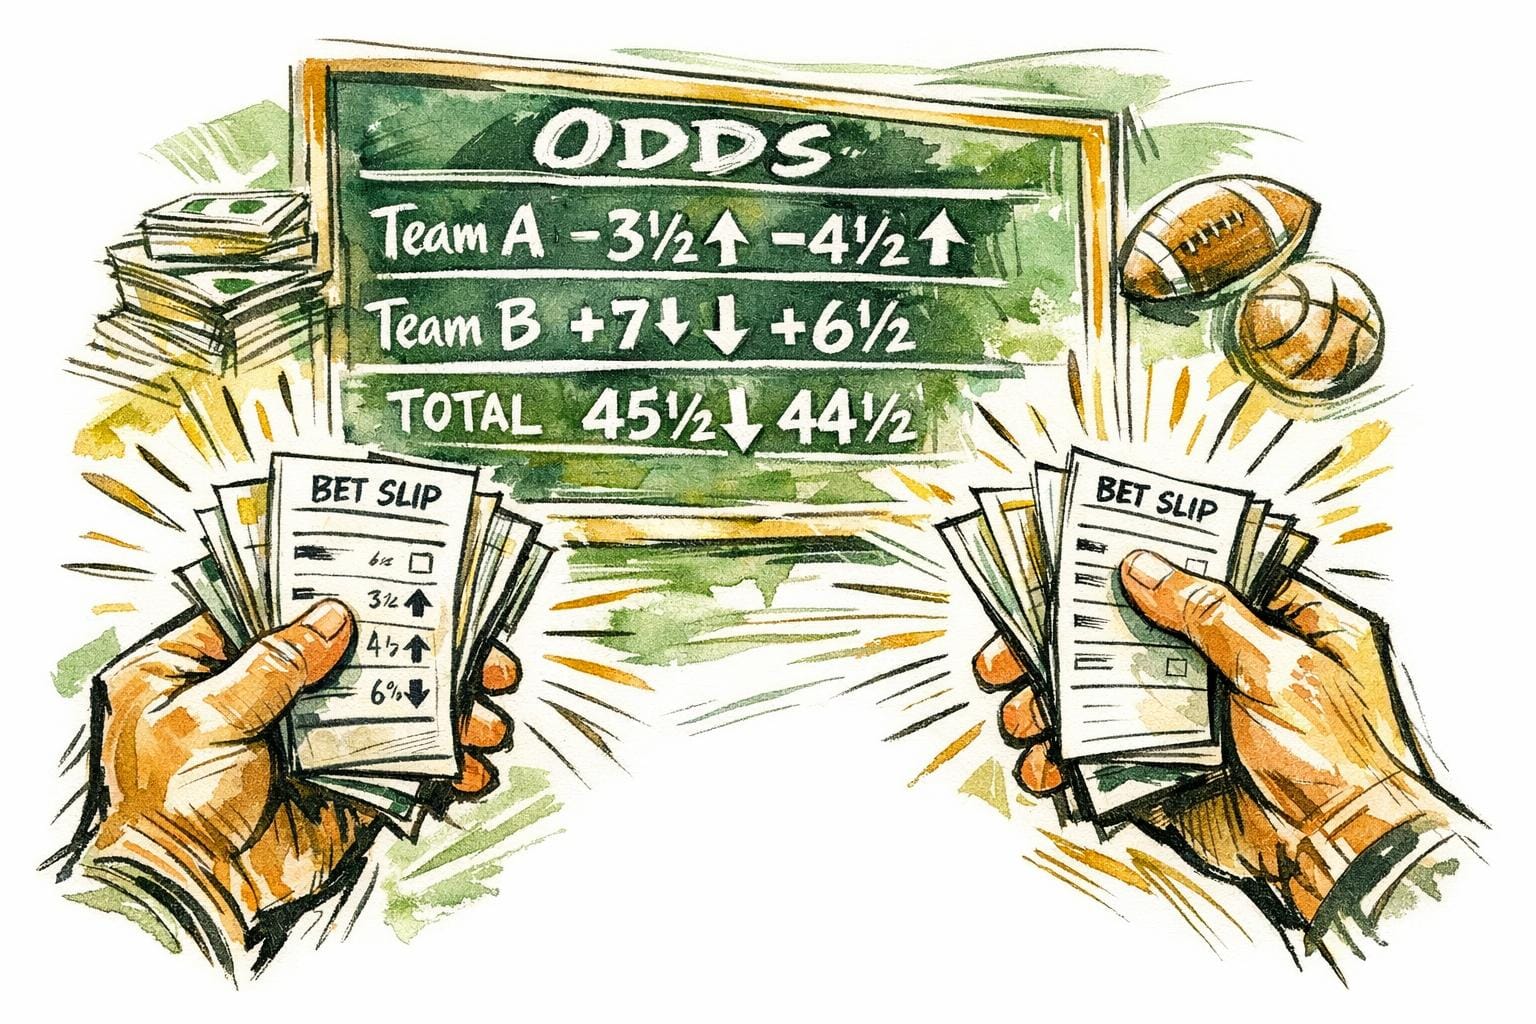
When public money floods sportsbooks, it often skews betting lines, creating opportunities for sharp bettors to profit. Casual bettors tend to favor favorites, home teams, and high-scoring games, often driven by emotions or media hype. Sportsbooks respond by adjusting lines, which can reduce value for public bets and open doors for contrarian strategies.
Key takeaways:
- Public bettors lean heavily on favorites and overs, influenced by recency bias and media narratives.
- Sharp bettors exploit these trends, focusing on value where public sentiment distorts odds.
- Reverse Line Movement (RLM) signals sharp action when lines move against public betting percentages.
- Historical data shows underdogs with little public support yield better returns, especially in heavily bet games.
- Tools like real-time betting splits and AI simulations help identify sharp money and contrarian opportunities.
Understanding these patterns can help you make smarter bets and avoid common public pitfalls.
How to Read the Sports Betting Market (The Complete Beginner’s Guide)
The Problem: Public Money Distorts Betting Lines and Reduces Value
When casual bettors overwhelmingly back one side, sportsbooks adjust the lines to limit their exposure - ultimately diminishing the value of wagers.
Why the Public Leans Toward Favorites and Overs
Public betting habits often lean heavily on favorites, home teams, and high-scoring games. Why? It’s a mix of emotion and influence. Many casual bettors rely on gut feelings rather than data, and media coverage plays a big role in amplifying these biases. Teams with superstar players or recent standout performances often dominate headlines, leading to a surge in public bets on those teams or outcomes. Sportsbooks, anticipating this behavior, adjust spreads and odds accordingly, making it harder for bettors to find profitable opportunities.
For example, a small adjustment - shading a moneyline by just 1%-1.5% - can significantly impact returns. A $10 bet might yield $0.31 less in profit, and over the course of four bets, that loss adds up to $3.69. Take the NFL: in one instance, 84% of public bets and 88% of the money were placed on the "over." By the time most bettors placed their wagers, the line had already been adjusted to reflect the heavy public action, eroding its value.
Recency bias also plays a huge role. If a team delivers a dominant performance, casual bettors often assume that success will continue, even when the adjusted spread no longer offers favorable odds. Sportsbooks capitalize on this by setting "trap lines" - odds that seem too attractive to resist but are designed to exploit these assumptions.
What Reverse Line Movement Tells Us
Reverse Line Movement (RLM) is a phenomenon where the betting line shifts in the opposite direction of the public's betting percentages. For instance, if 70% of bets are placed on a favorite but the spread moves to make it easier for that team to cover, it’s a sign that sharp money - bets from professional, data-driven bettors - is influencing the market.
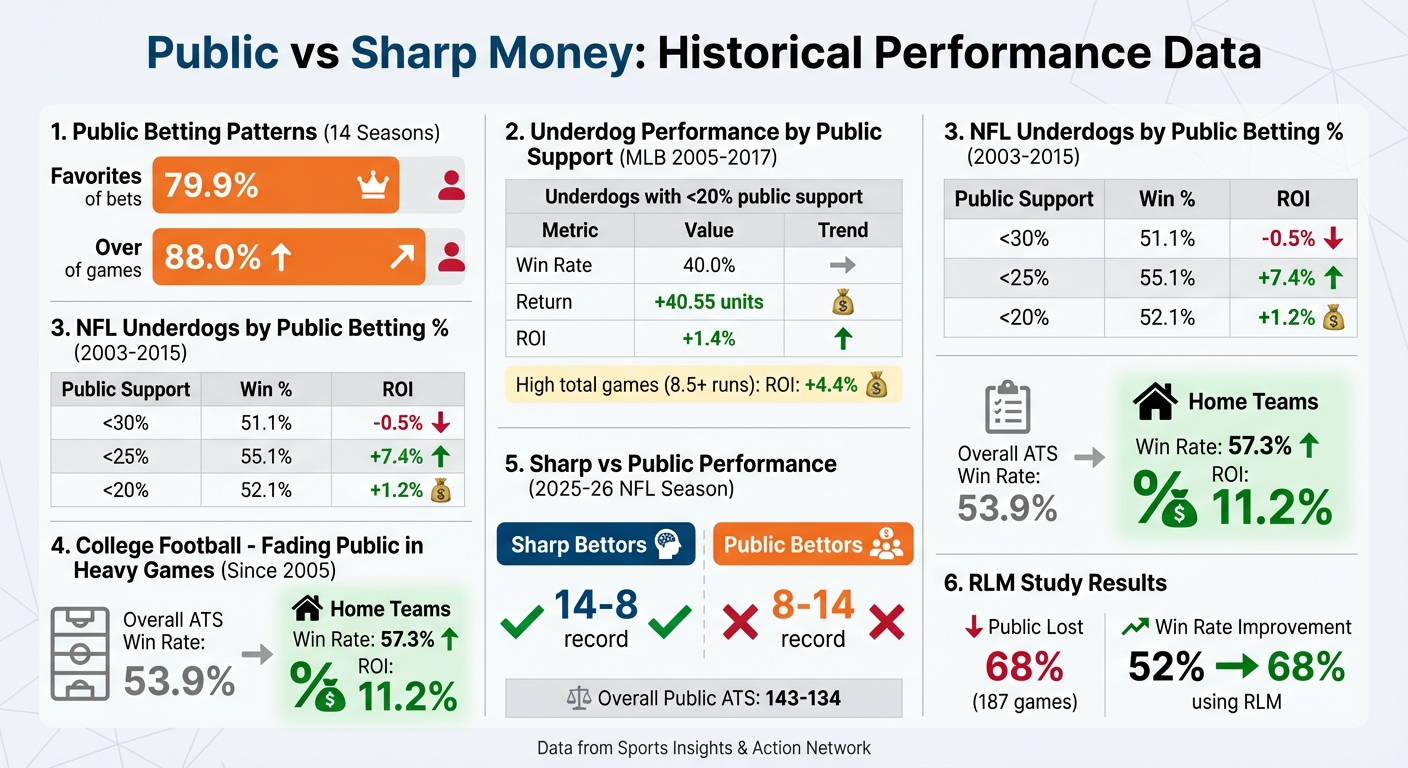
Sportsbooks take sharp action seriously because professionals have a track record of success. In one study tracking 274 games with RLM, the public’s bets were on the losing side 68% of the time (187 games). One bettor even reported improving their win rate from 52% to 68% by focusing on RLM signals rather than following public trends.
This highlights a critical reality: the public rarely comes out ahead. While sportsbooks may occasionally lose to sharp bettors, they consistently profit from casual bettors who chase popular narratives without considering how lines have already been adjusted. Recognizing these dynamics is key to building data-driven strategies that can uncover opportunities in the betting market.
Historical Data: How Public Money Has Affected Betting Edges Over Time
Public vs Sharp Betting Performance: Historical Data and ROI Comparison
Recurring Patterns in Public Betting Behavior
Over a span of 14 seasons, favorites attracted 79.9% of bets, while the "Over" was picked in 88.0% of games. These numbers highlight consistent betting biases that shape public behavior.
These trends reveal opportunities for bettors who go against the grain. For instance, in MLB games from 2005 to 2017, underdogs receiving less than 20% of moneyline tickets delivered a return of +40.55 units with a 40.0% win rate, translating to a +1.4% ROI. The advantage grew when these underdogs played in games with high totals (8.5 runs or more), where the ROI jumped to +4.4%. This pattern isn’t unique to baseball - across various sports, when the public heavily backs one side, the value often lies with the less popular choice.
In college football, fading the public in heavily bet games (those with at least 2.5 times the daily average number of bets) resulted in a 53.9% ATS win rate since 2005. Home teams in these scenarios performed even better, achieving a 57.3% win rate and an 11.2% ROI. The more one-sided the public action, the stronger the edge becomes.
Public vs. Sharp Money Splits: What the Numbers Show
The relationship between ticket percentages and money percentages offers a glimpse into where professional bettors are placing their wagers. Take, for example, an NFL game on January 4, 2025, where the Cleveland Browns drew only 7% of total bets but accounted for 49% of the total money wagered. This stark contrast signals sharp action, even as the public favored the Ravens.
During the 2025-26 NFL season, scenarios tracking "Sharp vs. Public" action revealed sharp bettors achieving a 14-8 record, while the public went 8-14. Overall, the public’s ATS record for that season stood at 143-134 as of mid-January 2026. These splits aren’t random; they reflect the market adjusting to predictable public tendencies. When a team has a low percentage of bets but a high percentage of money, it’s often a sign of larger, more informed wagers backing that side.
The numbers further illustrate sharp action:
| Public Betting % (NFL Underdogs) | Winning Percentage | ROI |
|---|---|---|
| < 30% | 51.1% | -0.5% |
| < 25% | 55.1% | +7.4% |
| < 20% | 52.1% | +1.2% |
Source: Sports Insights historical data 2003-2015
The threshold here is key. Simply fading the public when support is at 40% or 45% rarely pays off. However, when public backing drops below 25%, the ROI becomes noteworthy. The edge sharpens even further when these underdogs are coming off a blowout loss of 7+ points, pushing the ROI to 17.3%. The data is clear: public money often skews lines, and identifying these distortions can provide a significant advantage.
These historical trends emphasize the importance of real-time evaluation to take full advantage of public money dynamics.
Solutions: How to Use Data to Profit from Public Money Trends
Monitor Public vs. Sharp Money Splits in Real Time
Keeping an eye on the difference between bet percentages and money percentages can reveal where professional bettors are placing their wagers. For instance, if a team garners only 20% of the total bets but accounts for 50% of the money wagered, it’s a clear sign that sharp bettors are backing that side. This gap serves as a reliable indicator of sharp action.
Another important clue comes from reverse line movement. Imagine 70% of public bets favor a particular team, yet the line shifts in favor of the underdog - this shows sportsbooks are reacting to sharp money pouring in on the less popular side. These discrepancies often highlight where sharp action is influencing the market.
Platforms like WagerProof make it easier to track these trends in real time. By monitoring mismatches between public betting percentages and money flow, the platform sends automated alerts when market spreads don’t align. This allows you to quickly spot where sharp action is moving and adjust your strategy accordingly.
Once you’ve identified these trends, the next step is to focus on games where heavy public betting creates opportunities for contrarian plays.
Fade Games with Heavy Public Action
Betting against the public in high-volume games has historically been a profitable strategy. The trick is to pinpoint games with a significant imbalance in public action. Take, for example, a September 2018 matchup where Michigan was a 2.5-point favorite against Notre Dame. Michigan had 63% of the tickets, making it the most heavily bet game of the day. Betting on Notre Dame +3 in this scenario aligned perfectly with a contrarian approach. As PJ Walsh from Action Network puts it:
"Oddsmakers are very adept at predicting where public money will go. They react by shading their lines to make the popular sides of certain games less valuable than their power ratings imply."
WagerProof simplifies this process by flagging games where public action exceeds 70% on one side. These automated alerts save you the hassle of manually tracking multiple games, giving you a straightforward way to identify contrarian opportunities.
But before diving into these strategies, it’s critical to test them thoroughly using historical data and simulations.
Test Strategies Using Historical Data and AI Simulation
Once you’ve identified trends and potential contrarian plays, the next step is to validate these strategies. Running matchups through simulation tools can help determine whether the public trend is worth following or if it’s a trap. WagerProof’s AI Game Simulator leverages current team stats, player performance data, and historical matchups to simulate multiple scenarios and predict a range of outcomes. This removes emotional bias and grounds your decisions in data.
For more interactive support, WagerBot Chat acts as a real-time assistant, answering questions about specific games, players, or betting strategies. Unlike general-purpose AI, WagerBot connects to live professional data, ensuring its insights are up-to-date and accurate. Whether you’re curious about public money trends or historical performance in similar situations, WagerBot has you covered.
It’s worth noting that AI betting tools typically achieve prediction accuracy between 50% and 60%, while professional sharp bettors maintain a success rate of about 57%. The goal here isn’t to achieve perfection but to build consistency. By testing your strategies against historical data and simulating current matchups, you can approach your bets with greater confidence. WagerProof’s Premium Plan grants full access to tools like the AI Game Simulator and WagerBot Chat, along with entry to a private Discord community where members exchange insights and refine strategies in real time.
Conclusion: Using Data to Beat Public Money Trends
Betting trends shaped by public money often reveal patterns that can be turned into an advantage. Historical data shows that underdogs with little public support tend to deliver better returns, especially when specific situational factors are considered. These patterns stem from the public's inclination to favor favorites, home teams, and high-scoring games. Leveraging this knowledge allows for the development of strategies that counter these predictable biases.
The secret lies in real-time tracking of proven historical trends. By monitoring the gaps between bet percentages and money percentages, you can identify sharp action. Tools like WagerProof’s automated alerts and AI Game Simulator help validate these insights by comparing them to historical matchup data.
It's worth noting that professional bettors - often referred to as sharps - win about 57% of their bets, which is just enough to surpass the 52.38% break-even point. Their success isn’t based on hunches but on a disciplined, data-driven approach.
For the best results, focus on matchups closer to kickoff when data becomes more reliable. Look for opportunities to bet against heavy public action, especially when sharp money indicators align. With WagerProof’s tools tracking betting splits, identifying reverse line movement, and simulating potential outcomes, you can base your decisions on solid evidence rather than emotion. By consistently targeting games with uneven splits and aligning your bets with sharp indicators, you can build a strategy rooted in the trends and principles outlined here.
FAQs
How do public betting trends influence odds and create opportunities for smart bettors?
Public bets, often placed by casual fans, play a big role in how sportsbooks adjust their odds. When a large majority of bets - say, over 60% - leans toward one side, sportsbooks usually tweak the odds to balance their risk. This process, called line shading, can inflate the odds for the popular choice while undervaluing the less favored side.
Savvy bettors, often referred to as sharps, know how to capitalize on these shifts. They analyze betting splits, look for reverse line movement (when the odds move against the public's bets), and compare the percentage of bets to the percentage of money wagered. For instance, if 70% of bets are on Team A but only 40% of the money supports them, it could indicate that high-stakes bettors (the sharps) are backing Team B. This kind of imbalance often points to an opportunity to bet against the public.
Tools like WagerProof provide real-time insights into public betting trends, money percentages, and line movements. These platforms help bettors identify these opportunities quickly, giving them the chance to make more informed wagers.
What is reverse line movement, and why does it indicate sharp betting activity?
Reverse line movement (RLM) occurs when a sportsbook’s odds shift against the side attracting the majority of public bets. For instance, imagine 70% of bets are backing the Lakers at -5, yet the line moves to -4. This shift goes against public betting trends, often pointing to sharp bettors - professionals placing large, well-informed wagers - driving the change.
Sportsbooks adjust lines to balance risk, prioritizing sharp bets over a high volume of smaller public wagers. RLM can signal insider information, advanced analytics, or breaking news that hasn’t yet reached the general public. Spotting RLM, such as a line moving away from a team with 60% or more of the bets, can reveal where sharp money is being placed. Tools like WagerProof allow you to monitor real-time line changes and public betting percentages, helping you make more informed betting decisions.
Why do underdogs with little public support often offer better betting value?
Underdogs with little public support often offer more value because casual bettors tend to favor well-known teams or recent champions. This bias pushes sportsbooks to adjust the odds, favoring the popular pick and inflating the potential payouts for underdogs. Essentially, the betting line is tweaked to balance the heavy action on the favorite.
Seasoned bettors use this to their advantage by spotting gaps between the actual likelihood of an underdog winning and the generous odds being offered. When public money heavily favors one side, it can indicate that professional bettors are backing the underdog or that the market has overreacted to hype. Betting against the public and focusing on underdogs that are undervalued can lead to higher returns.
Tools like WagerProof make this process simpler. They let you track live public-bet percentages, money-lean indicators, and send alerts for underdogs with minimal public backing. This helps you quickly identify and act on these profitable opportunities with confidence.
Related Blog Posts
Ready to bet smarter?
WagerProof uses real data and advanced analytics to help you make informed betting decisions. Get access to professional-grade predictions for NFL, College Football, and more.
Get Started Free