Public Money vs. Consensus Models: Historical Results
When it comes to sports betting, you often face two options: follow public money (bets placed by casual fans) or trust consensus models (data-driven predictions from experts or algorithms). Here's the key takeaway:
- Public money tends to be emotional and biased, often favoring popular teams or recent performance. This approach frequently leads to poor accuracy and negative returns, with an average ROI of -8.06% during the 2020 NFL season.
- Consensus models aggregate expert opinions and historical data for higher accuracy. While they predict outcomes well, profitability depends on finding value bets and overcoming bookmaker fees.
Key Stats:
- Public money bettors often lose due to biases like recency and favorite bias.
- In NBA betting, fading public money at a 25% threshold yielded a 30.1% ROI.
- Consensus models are more accurate, capturing 86% of game outcome variability, but profitability requires calibration and spotting value bets.
Bottom line: Combining insights from both public money and consensus models can improve your betting strategy. Look for mismatches, like low ticket percentages paired with high money percentages, to identify sharp action and potential value.
Most ‘Models’ in Sports Betting Are Fake... Here’s How to Tell | Presented by Kalshi
1. Public Money
Public money refers to the betting decisions made by casual bettors, often driven by emotion, loyalty to their favorite teams, or media narratives. These bettors, sometimes labeled as "Takers" in prediction markets, tend to follow predictable patterns that frequently undermine their own chances of success.
Accuracy in Predicting Outcomes
The predictive power of public money is notably weak. For example, during the 2020 NFL regular season, researcher Tucker Boynton examined 255 games and found that favorites - teams receiving 57.6% of all money wagered on the spread - only managed to cover 44.3% of the time. This highlights how public bettors often overvalue favorites and popular teams, creating a disconnect between their wagers and actual game outcomes.
This issue isn’t confined to football. On the Kalshi prediction market, contracts priced at just 5 cents had a winning rate of only 4.18%, reflecting a mispricing of -16.36%. This tendency to overpay for long-shot outcomes is known as the "Optimism Tax." Such mispricing directly contributes to the poor returns that public money bettors experience.
Return on Investment (ROI)
The ROI for public money bettors is consistently negative. In the same 2020 NFL season, following public money trends led to an average ROI of -8.06%. By contrast, a contrarian strategy - such as betting exclusively on home underdogs - delivered a positive ROI of +8.40%.
The disparity is even more pronounced in prediction markets. Between 2021 and November 2025, an analysis of 72.1 million trades on Kalshi revealed that public bettors (Takers) lost an average of 1.12% per trade, while professional liquidity providers (Makers) profited from those losses. Tucker Boynton noted:
By concentrating bets on favorites, bookmakers increased their per-game returns by more than 300%.
Bias and Market Influence
Public money doesn’t just struggle with accuracy and ROI - it also distorts market lines. Recreational bettors often fall victim to recency bias, overestimating the importance of a team’s most recent performance while ignoring broader season trends. They also exhibit herd behavior, piling onto favorites and skewing the odds.
This dynamic gives rise to "reverse line movement", where betting lines shift against the public majority because professional bettors heavily back the less popular side. Bookmakers, rather than balancing their books, actively take positions against public biases in about 90% of NFL games. The public’s preference for favorites, "over" bets, and affirmative "YES" outcomes creates inefficiencies that sharper bettors and bookmakers exploit for profit. These patterns highlight the vulnerabilities of public money compared to strategies rooted in data and analysis.
2. Consensus Models
Consensus models - like prediction markets, closing betting odds, and combined predictions - tap into the collective intelligence of the betting market. These models often outperform individual experts and professional tipsters in accuracy. For example, in German league data, betting odds had a hit rate of 52.93%, slightly better than prediction markets at 52.69%, while tipsters lagged far behind at just 42.86%. Let’s dive into how these models perform in terms of accuracy, ROI, and their inherent biases.
Accuracy in Predicting Outcomes
The strength of consensus models lies in their ability to process and combine enormous amounts of information. Sportsbook point spreads, which reflect market consensus, account for 86% of the variability in median game outcomes. Both prediction markets and bookmaker odds achieve similarly high levels of accuracy, proving their effectiveness as information aggregators. Interestingly, even a small bias - like a sportsbook deviating by a single point from the true median outcome - can create opportunities for bettors to achieve positive expected profits.
However, accuracy alone doesn’t guarantee profitability. Conor Walsh from the University of Bath's Department of Computer Science put it best:
A highly accurate predictive model is useless as long as it coincides with the bookmaker's model.
This is where calibration becomes critical. Calibration ensures that predicted probabilities align closely with actual outcomes, which directly impacts profitability. For instance, in NBA betting simulations, machine learning models selected for calibration achieved an impressive ROI of +34.69%, while those chosen solely for accuracy suffered an ROI of -35.17%.
Return on Investment (ROI)
Even with high accuracy, turning predictions into profit is tricky. Market consensus, often reflected in closing lines, excels at predicting outcomes but struggles to deliver positive ROI due to steep bookmaker fees, or "vig". To achieve consistent profitability, these fees need to be much lower than the 25% charged by some state-owned bookmakers.
For seasoned bettors using advanced models, a long-term ROI of 3% to 7% is a realistic goal, while anything above 10% is rare and challenging to sustain. The secret to profitability lies in spotting value bets - situations where the model's predicted probability is higher than the probability implied by the bookmaker's odds. Tracking Closing Line Value (CLV) is a reliable way to measure long-term profitability. Additionally, strategies like line shopping across multiple sportsbooks can boost annual ROI by 1% to 2%, and peer-to-peer betting systems that eliminate the vig can increase individual bet returns by 5% to 10%.
Bias and Market Influence
While consensus models are highly accurate, they aren’t free from bias. One common issue is the favorite-longshot bias, where people tend to overestimate unlikely outcomes and undervalue likely ones. This pattern is evident in prediction markets. In sports betting, the crowd often shows a favorite bias when betting against point spreads, even when those spreads are designed to disadvantage the favorite.
Between 2011 and 2013, researchers Joseph P. Simmons, Leif D. Nelson, Jeff Galak, and Shane Frederick studied NFL fans who wagered over $20,000 on football predictions. They found that bettors consistently favored favorites over underdogs, even when point spreads clearly disadvantaged the favorites. This bias grew stronger as the season progressed. As Simmons explained:
Faulty intuitions led the crowd to predict 'favorites' more than 'underdogs' against point spreads that disadvantaged favorites, even when bettors knew that the spreads disadvantaged favorites.
Interestingly, biases are more pronounced in binary choices than in numerical estimations. Additionally, simple aggregates of prediction polls often lack confidence, producing forecasts that hover too close to 50%. Advanced aggregation algorithms, however, can outperform both raw prediction markets and basic crowd predictions.
Pros and Cons
Public Money vs Consensus Models: ROI Performance and Key Differences
Here’s a closer look at the strengths and weaknesses of public money and consensus models in sports betting. Each approach offers distinct insights that can shape your betting strategy, so understanding their differences is key to making informed decisions.
Public Money
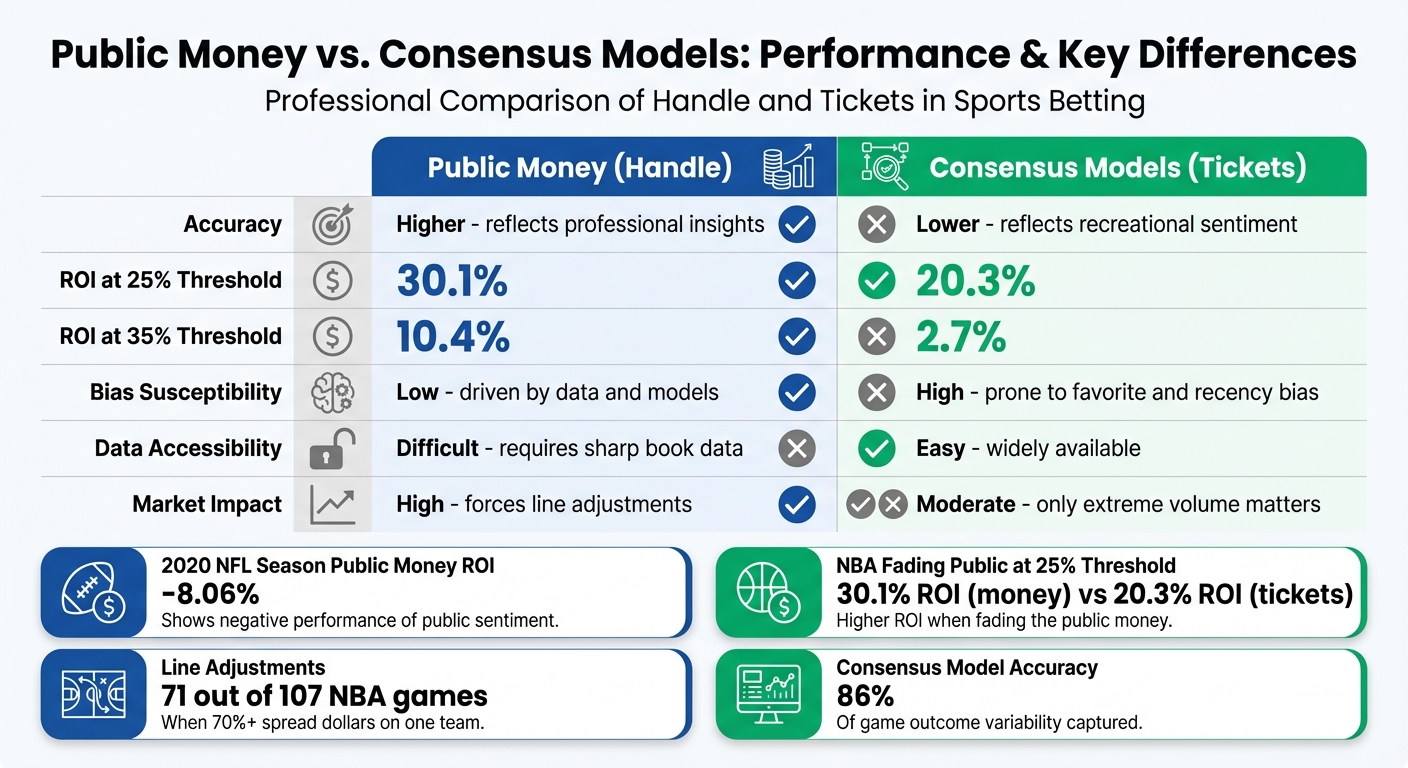
Public money, often referred to as the "handle", tracks the actual dollar amounts wagered. This metric is particularly valuable because it highlights where professional bettors, or "sharps", are placing their bets. Unlike ticket counts, which only show the volume of bets, public money reveals the financial liability sportsbooks face. For example, in NBA betting, fading the public at the 25% threshold using money percentages delivered a 30.1% ROI - outpacing the 20.3% ROI achieved with ticket percentages.
However, there are challenges. Accessing reliable sharp sportsbook data is notoriously difficult, and bettors must overcome the standard vigorish, requiring a win rate of at least 52.4% just to break even.
Consensus Models
Consensus models, on the other hand, are based on ticket counts and are much easier to access. These models show which side the general public is betting on, making them useful for identifying contrarian opportunities. Recreational bettors often make predictable mistakes, such as favoring recent performance or popular teams, leading to biases like favorite and recency bias. As Tony Farmer from Odds Shark notes:
If public bettors won consistently and long term, sportsbooks wouldn't profit as much. Sports betting apps capitalize on the predictable mistakes of recreational bettors who tend to lose long term.
While consensus models are widely available, they lack the depth of public money data. Ticket volume alone rarely causes sportsbooks to adjust their lines unless the volume is extreme. David Solar from Sports Insights explains:
It's important to know which side is receiving the majority of tickets, but it's far more crucial to understand which side is receiving a majority of the money since books are far more likely to adjust their lines if they have significant liability on one side.
Key Differences at a Glance
| Metric | Public Money (Handle) | Consensus Models (Tickets) |
|---|---|---|
| Accuracy | Higher; reflects professional insights | Lower; reflects recreational sentiment |
| ROI Potential | 30.1% at 25% threshold | 20.3% at 25% threshold |
| Bias Susceptibility | Low; driven by data and models | High; prone to favorite and recency bias |
| Accessibility | Difficult; requires sharp book data | Easy; widely available |
| Market Impact | High; forces line adjustments | Moderate; only extreme volume matters |
Practical Application
The differences between public money and consensus models significantly impact how sportsbooks adjust their lines. For instance, when one team received 70% or more of the spread dollars, sportsbooks adjusted the line in 71 out of 107 NBA games studied. This level of market impact is rarely seen with ticket volume alone.
WagerProof simplifies this process by tracking both public betting percentages and money leans in real time. The platform identifies key gaps - like when a team has only 20% of tickets but 75% of the money - highlighting sharp action worth noting. By leveraging these insights, bettors can better understand how public money and consensus models contribute to successful sports betting strategies.
Conclusion
Looking back at historical trends, there’s a clear difference in performance when comparing public money metrics to consensus models. For example, fading the public at a 25% threshold using money percentages resulted in a 30.1% ROI for NBA betting, while relying on ticket percentages only delivered a 20.3% ROI. At the 35% threshold, the gap becomes even more pronounced - money-based fading achieved a 10.4% ROI, compared to just 2.7% ROI for ticket-based strategies. This reinforces the idea that sportsbooks adjust their lines based on financial liability rather than the sheer number of bets placed.
Consensus models still serve an important role, especially for identifying contrarian opportunities. The real edge, however, lies in spotting mismatches - like when a low ticket percentage is paired with high money percentages, often signaling sharp action. These discrepancies can provide valuable insights for bettors looking to gain an advantage.
To maximize success, combining both public money and consensus models strategically is key. Research shows that blending different forecasting methods can significantly improve accuracy. This means waiting for alignment: when both metrics point in the same direction, your chances of making a successful wager increase.
Platforms like WagerProof make this process easier by tracking public money and consensus data in real time. It highlights outliers, value bets, and mismatches in market spreads - alerting you to potential fade opportunities and sharp money moves. Instead of juggling multiple sources or manually analyzing percentages, WagerProof’s WagerBot Chat delivers accurate, live data to help you make informed decisions.
Whether you prefer fading the public or following sharp money, leveraging insights from both public money and consensus models gives you an undeniable edge. The historical data backs it up: combining these metrics leads to better outcomes.
FAQs
How do I tell sharp money from public money?
Sharp money refers to bets placed by professional gamblers who rely on extensive data and analysis to make their decisions. These wagers, often substantial, can shift betting lines. On the other hand, public money comes from casual bettors making smaller bets, frequently backing well-known or favored teams.
To spot sharp action, keep an eye out for reverse line movement (RLM) - this happens when the betting line moves against the majority of public bets. Another key indicator is when the Money % (total money wagered) differs significantly from the Ticket % (number of bets). For example, if fewer bets are placed on an underdog, but a large portion of the money is backing them, it’s often a sign of sharp bettors at work.
What makes a consensus model profitable, not just accurate?
A consensus model can generate profits by pooling collective information to uncover betting opportunities that offer a positive expected value. This happens when the model's predicted probability is greater than the implied probability derived from the odds. Success also hinges on spotting market inefficiencies, incorporating a variety of data sources, and employing smart betting strategies like effective stake sizing and careful risk management. Additionally, tools that pinpoint value bets and flag outliers can play a key role in improving decision-making and maintaining long-term profitability.
What’s the simplest way to combine tickets, money, and line movement?
To identify sharp betting activity, start by examining the gap between Ticket % (the number of bets placed) and Money % (the total amount wagered). When this gap surpasses 10%, it often indicates sharp bettors are involved. Pay close attention to reverse line movement (RLM) - this happens when the betting line moves in the opposite direction of public sentiment. It’s a strong clue that sharp money is influencing the market.
Using tools like WagerProof can make this process easier. These tools can send you instant alerts for patterns like RLM, helping you quickly identify value bets and stay on top of market trends.
Related Blog Posts
Ready to bet smarter?
WagerProof uses real data and advanced analytics to help you make informed betting decisions. Get access to professional-grade predictions for NFL, College Football, and more.
Get Started Free