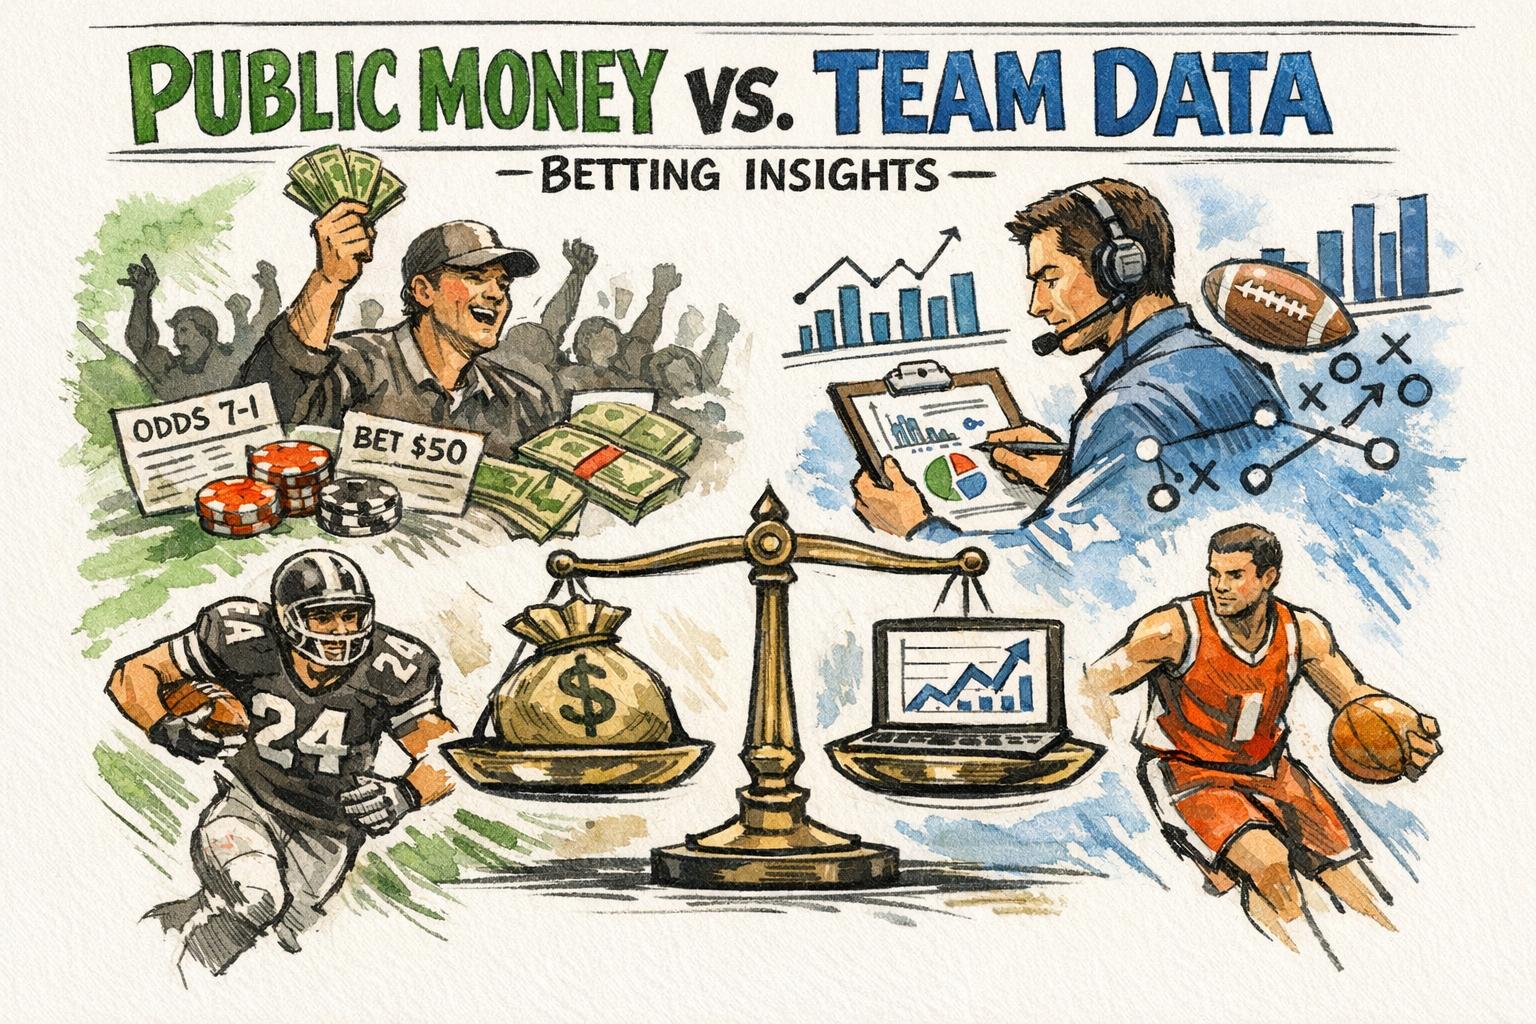
Public Money vs. Team Data: Betting Insights
Public money and team data are two key tools for smarter sports betting. Public money shows where most bets are placed, helping you spot market trends and potential value plays. Team data dives into stats like performance metrics, injuries, and historical matchups to predict outcomes more accurately.
Here’s the quick breakdown:
- Public money tracks casual bets vs. sharp bets, revealing market biases.
- Team data focuses on stats and advanced metrics for fair value assessment.
- Combining both improves decision-making by balancing market sentiment with game fundamentals.
Key Takeaways:
- Casual bettors often favor favorites, home teams, and high-scoring outcomes ("Overs").
- Sharp bettors use team data to exploit market inefficiencies and often bet on underdogs or "Unders."
- Tools like WagerProof help merge public trends with team stats for better insights.
For consistent success, use public money as a signal and validate it with team data before placing your bets.
1. Public Money
Accuracy in Predicting Outcomes
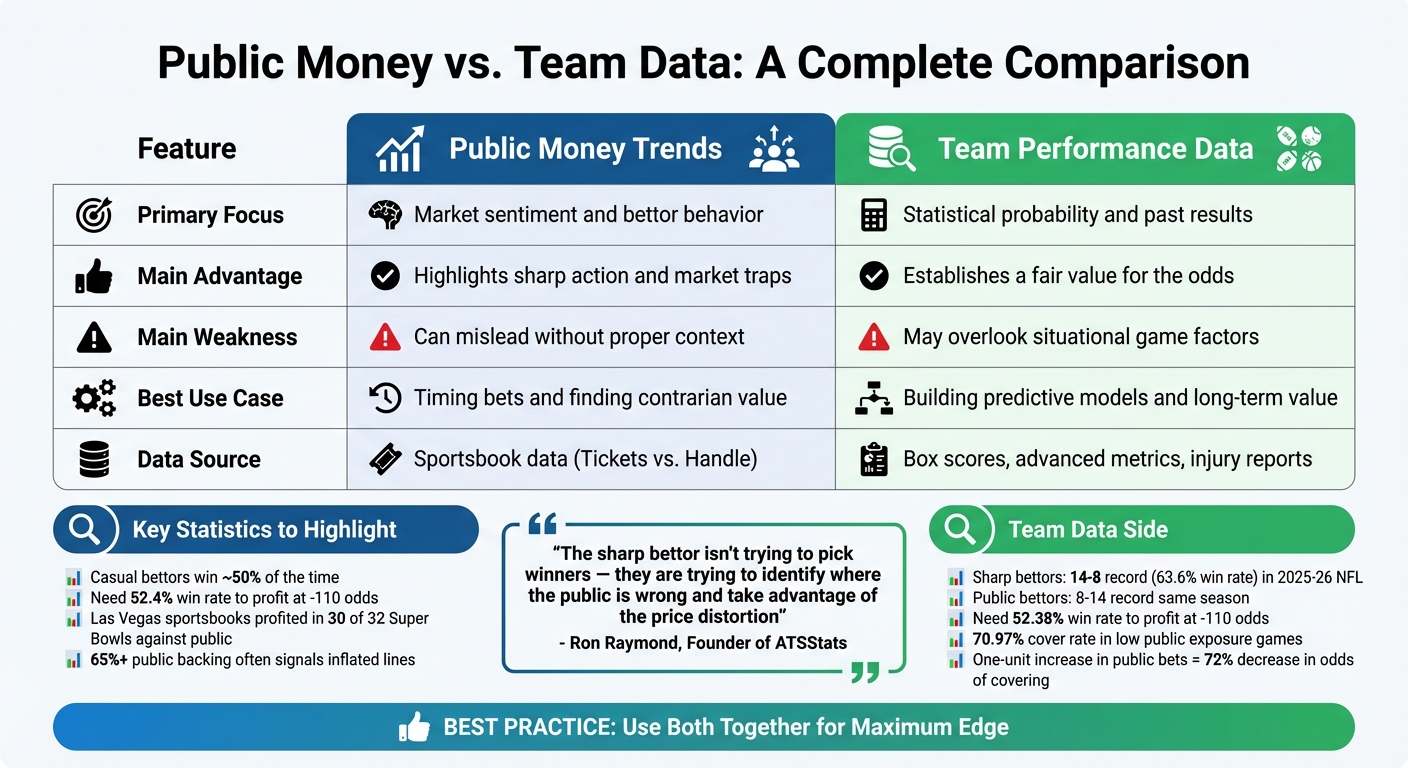
Public betting trends reveal where casual bettors place their wagers, but their ability to predict outcomes is often limited. While casual bettors win about 50% of the time, beating the sportsbook's commission on standard NFL spreads (-110 odds) requires a win rate of over 52.4% to turn a profit. Because of this, most casual betting strategies lose money in the long run. For instance, Las Vegas sportsbooks have profited in 30 of the last 32 Super Bowls by effectively countering public betting trends. Many casual bets are influenced by gut instincts, recent team performance, or media hype rather than solid statistical analysis. This reliance on instinct and bias contributes to the unpredictability of public betting outcomes.
Impact of Bias
Casual bettors tend to favor favorites, home teams, and "Overs" in total points markets. This preference is often driven by recency bias, where bettors lean toward teams that have recently performed well or are receiving significant media attention. Such trends can inflate betting lines, creating opportunities for contrarian bettors to find value - usually by backing underdogs or betting on "Unders." For example, reverse line movement can indicate strategic betting activity: if 80% of bets are on a favorite but the line shifts toward the underdog, it suggests that sharper, more calculated money is influencing the market. Additionally, since public money tends to flow in closer to game time or during primetime matchups, those betting on underdogs can often secure better odds by waiting until just before kickoff. These patterns not only shape the betting market but also highlight the biases inherent in public wagering.
Ease of Access to Insights
Public betting data is now easier to access than ever. Major sportsbooks like DraftKings and FanDuel regularly share public betting splits through newsletters and social media. These insights help bettors identify the divide between casual and strategic wagers. For example, when the percentage of tickets is high but the money percentage is relatively low, it often signals that casual bettors are backing one side while larger, more strategic bets are going the other way. Tools like WagerProof take this a step further by automatically flagging outliers and identifying value bets. These platforms send alerts when betting spreads diverge, offering signals to fade certain games. Public betting splits can serve as a useful starting point for deeper matchup analysis.
2. Team Data
Accuracy in Predicting Outcomes
Team performance data forms the backbone of sharp money - the wagers placed by seasoned professionals who rely on cold, hard stats rather than gut feelings or hype. For sharp bettors, success isn't about simply picking winners; it's about identifying odds that don't align with reality. To profit at -110 odds, sharps need to win over 52.38% of their bets. Ron Raymond, Founder of ATSstats.com, sums it up well:
"The sharp bettor isn't trying to pick winners - they are trying to identify where the public is wrong and take advantage of the price distortion."
This approach was validated during the 2025–26 NFL season. Professional sharps achieved a 14–8 record (63.6% win rate) in head-to-head matchups, while public bettors struggled with an 8–14 record. Sharps focus on factors like situational angles, injury updates, and market trends rather than getting swept up in star performances or recent headlines. This reliance on statistical models not only improves win rates but also highlights market inefficiencies.
Value Identification
The real strength of team data lies in its ability to pinpoint where market prices veer away from fair value. Advanced metrics such as Expected Points Added (EPA), Completion Percentage Over Expected (CPOE), and success rates offer deeper insights compared to traditional box score stats. These metrics reveal what genuinely contributes to winning, rather than just highlighting flashy plays.
For example, when public betting heavily favors a popular team, it can skew the line, reflecting the sportsbooks' respect for data-backed insights. A study of 197 NFL games revealed that teams receiving a larger share of public bets were significantly less likely to cover the spread. Specifically, a one-unit increase in "Bets %" correlated with a 72% decrease in the odds of covering.
Impact of Bias
Public bettors often fall victim to recency bias and loyalty to popular teams, but team data remains objective. High-profile teams like the Dallas Cowboys or New England Patriots frequently see inflated betting lines due to public enthusiasm, creating opportunities for contrarian bettors. In a subset of 31 games with low public exposure but high money percentages, teams covered the spread at an impressive 70.97% rate. Across the entire 2025–26 NFL season, data-driven betting models maintained a slight edge, with a 145–140 record. These models avoid the traps of public bias by analyzing thousands of historical matchups and considering variables like weather and player efficiency. However, even the best data isn't useful unless it's accessible and easy to interpret.
Ease of Access to Insights
While accessing team performance data has become more convenient, making sense of it still requires the right tools. Platforms like WagerProof integrate real-time sports data with powerful statistical models to highlight outliers and value bets. By combining this with public betting trends, these systems offer a dual perspective that sharpens decision-making. They can flag discrepancies in spreads, signaling potential value bets. Unlike traditional pick sites that simply hand out recommendations, data-driven platforms explain why a particular bet is worth considering. This transparency empowers bettors to identify opportunities on their own instead of blindly following tips.
How to Read Line Movement & Public Betting Percentage
To effectively track these movements, you can compare real-time sports data platforms that provide the necessary splits and analytics.
Pros and Cons
Public Money vs Team Data: Sports Betting Comparison
Public money trends and team performance data each bring their own strengths and weaknesses to the table, and relying on just one can lead to missteps. Understanding where each method shines - and where it stumbles - can sharpen your sports betting strategies.
Public money trends are excellent for gauging market sentiment and spotting opportunities to go against the crowd. For instance, when 65% or more of the tickets favor one side, as highlighted in the Public Money analysis, it often signals an inflated line due to heavy public backing. This can create value on the less-popular side, especially if sharp money points in that direction. However, the downside is that sportsbooks rarely provide full transparency about their betting ledger. Plus, the house edge (vigorish) can chip away at long-term profits.
On the other hand, team performance data offers a solid foundation for assessing fair value. Advanced stats cut through the noise and focus on what actually drives wins. But this method has its blind spots too. It often overlooks situational factors like player motivation, last-minute injuries, or changing weather conditions, which can heavily influence outcomes. Even the best models need context to make accurate predictions.
| Feature | Public Money Trends | Team Performance Data |
|---|---|---|
| Primary Focus | Market sentiment and bettor behavior | Statistical probability and past results |
| Main Advantage | Highlights sharp action and market traps | Establishes a fair value for the odds |
| Main Weakness | Can mislead without proper context | May overlook situational game factors |
| Best Use Case | Timing bets and finding contrarian value | Building predictive models and long-term value |
| Data Source | Sportsbook data (Tickets vs. Handle) | Box scores, advanced metrics, injury reports |
This comparison shows why blending both methods creates a more balanced and effective betting approach.
The key is to use both tools together. Public money trends can act as a signal to dig deeper, but they shouldn’t be your sole guide. For example, a strong public lean might prompt you to check team data to see if the line truly holds value. Platforms like WagerProof combine real-time public betting insights with advanced statistical modeling to pinpoint value bets. This dual approach helps you avoid the traps of emotional betting or relying on incomplete data.
Conclusion
Smarter betting comes down to merging public trends with team data for a well-rounded view of the market. Public money reveals crowd preferences and helps identify inflated lines, while team data provides the stats you need to pinpoint real value. On their own, these elements have limitations, but together, they give you a much clearer picture.
The real advantage lies in understanding when sharp bettors are going against the public. As Ron Raymond, Founder of ATSStats, explains:
"The sharp bettor isn't trying to pick winners - they are trying to identify where the public is wrong and take advantage of the price distortion".
This is where platforms like WagerProof come into play. By pulling real-time data from major sportsbooks and combining it with 50 statistical models, WagerProof highlights mispriced lines and simplifies the betting process. Their tools are designed to make data analysis efficient and actionable.
For instance, the Edge Finder identifies outliers by comparing model spreads to market odds, while the AI Game Simulator runs simulations to calculate win probabilities. The Public Money Splits tool is particularly useful, flagging instances where there’s a 10% or greater gap between Money % and Ticket %, signaling sharp action. These insights help you fine-tune your strategy and spot opportunities.
To make the most of these tools, monitor discrepancies and validate them with team data before placing a bet. Use staking strategies like Quarter Kelly or Half Kelly to manage your bankroll while accounting for uncertainties. Always factor in situational variables such as last-minute injuries or weather changes. WagerProof offers a Free Plan with access to the Edge Finder demo and basic stats, while the Premium Plan provides advanced tools, historical analytics, and access to a private Discord community.
FAQs
What’s the difference between Ticket % and Money %?
Ticket % refers to the percentage of total bets placed on a particular side. Essentially, it shows how many individual wagers have been made for that side compared to the total number of bets.
Money %, on the other hand, represents the percentage of the total money wagered on a specific side. This metric often highlights where larger or professional bets are being placed.
When you see a low Ticket % but a high Money %, it can suggest that sharp bettors - or those placing larger, more calculated wagers - are backing that side. This could signal potential value or indicate the influence of professional betting activity.
How do I spot reverse line movement in real time?
To spot reverse line movement (RLM), keep an eye on betting lines that move in the opposite direction of public betting trends. For instance, if more than 60% of bets are placed on one team, but the line shifts in favor of the other team, it often indicates that sharp bettors are supporting the less popular side. To identify these shifts, compare the opening and current lines, and rely on tools that provide public betting data for faster analysis.
How can I combine public money with team stats to find value?
To spot opportunities, focus on mismatches where public opinion leans heavily one way, but sharp money pushes in the opposite direction. Look for signs like reverse line movement or discrepancies between the percentage of money and tickets placed on a bet. These clues can highlight chances to go against the crowd. Using tracking tools to monitor these trends can lead to more informed and strategic betting choices.
Related Blog Posts
Ready to bet smarter?
WagerProof uses real data and advanced analytics to help you make informed betting decisions. Get access to professional-grade predictions for NFL, College Football, and more.
Get Started Free