
5 Steps To Quantify Betting Edge
Bet smarter, not harder. A betting edge occurs when your estimated probability of winning is higher than the sportsbook's implied probability. For example, if you believe a team has a 60% chance of winning but the sportsbook's odds reflect only a 54.5% chance, you have a 10% edge. This difference is where profit potential lies.
Here’s how you can calculate and use your edge in 5 steps:
- Understand Odds and Vig: Learn to convert American odds into implied probabilities and account for the sportsbook’s built-in margin (vig).
- Build a Probability Model: Use data like team stats, historical outcomes, and situational factors to estimate the true likelihood of events.
- Remove Vig: Adjust the sportsbook’s implied probabilities to calculate fair odds, giving you a clearer picture of true probabilities.
- Calculate Edge and Expected Value (EV): Compare your probability estimates to fair odds to assess your edge and determine the expected profit of your bets.
- Manage Your Bankroll: Use strategies like the Kelly Criterion to size your bets based on your edge while minimizing risk.
By following these steps, you can move from gambling to investing in sports betting. Tools like WagerProof simplify the process by automating calculations, analyzing odds, and tracking performance.
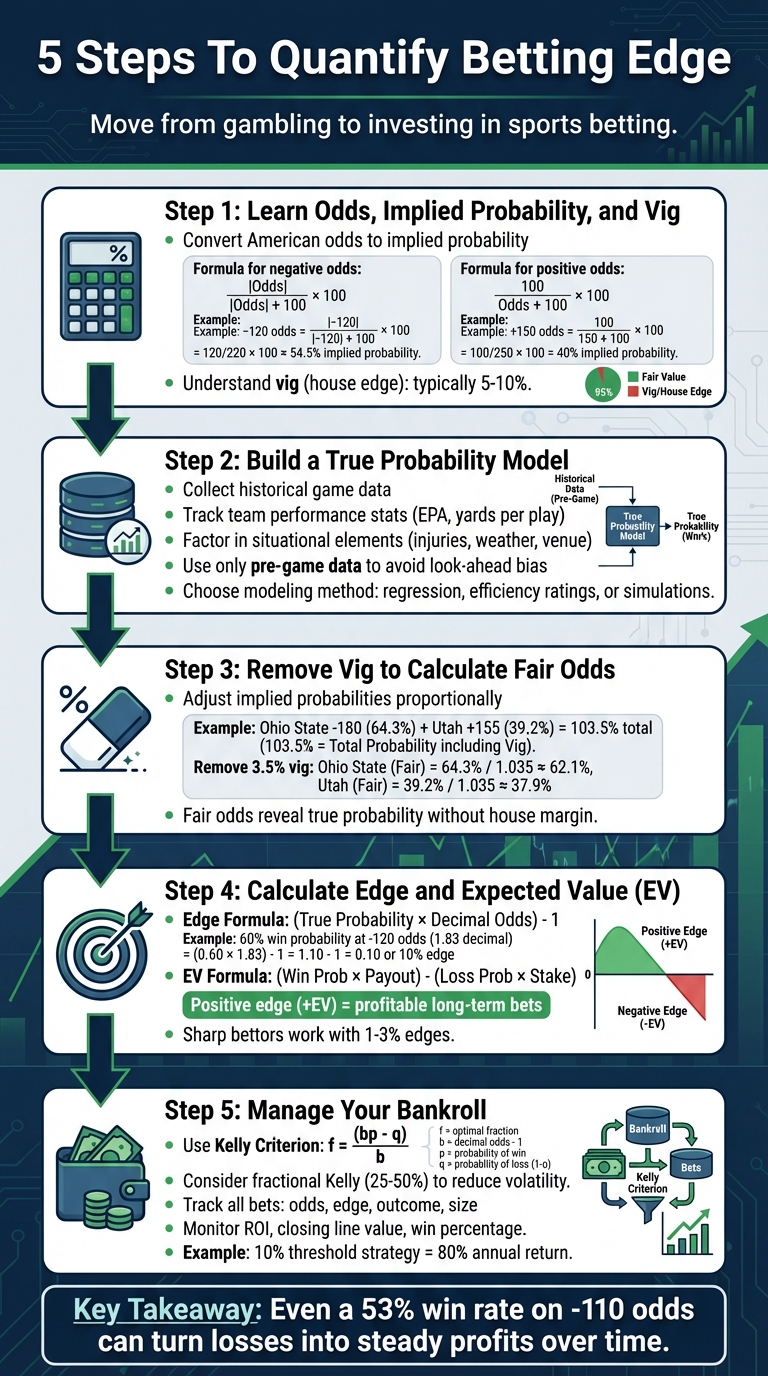
Key takeaway: Even a small edge, like a 53% win rate on -110 odds, can turn losses into steady profits over time.
5 Steps to Calculate and Use Your Betting Edge
Math Hacks - Calculating Your Edge - Your Most Useful Tool
Step 1: Learn Odds, Implied Probability, and Vig
Getting a handle on your betting edge starts with understanding how sportsbooks determine their odds. Each set of odds includes two critical elements: the implied probability of an outcome and the vig (short for vigorish or juice) that the sportsbook takes as its fee. Grasping these concepts is essential for spotting bets that might work in your favor.
How to Convert American Odds to Implied Probability
Implied probability is essentially the sportsbook's estimate of how likely an event is to happen, expressed as a percentage. By converting American odds into implied probability, you can compare the sportsbook's expectations with your own. If your estimated probability is higher than their implied probability, you may have uncovered a value bet.
Here’s how to do the math:
- For negative odds (favorites), use this formula: (Absolute Value of Odds) / ((Absolute Value of Odds) + 100) × 100
- For positive odds (underdogs), use this formula: 100 / (Odds + 100) × 100
Let’s break it down with examples:
- Odds of -120 convert to an implied probability of about 54.5%.
- Odds of +100 equal a 50% implied probability.
- Odds of -500 translate to roughly 83.3%, while odds of +450 come out to 18.1%.
"Being able to take American betting odds and convert them into implied probability is a key factor to assessing value in a particular betting market." – Nicole Russo, TheLines.com
To put this into perspective, imagine a coin toss. If a sportsbook offers odds of +125 for heads, the implied probability is 44.44%. Since a fair coin toss has a 50% chance, this difference could signal a value opportunity.
What Is Vig (House Edge)
Vig, or vigorish, is essentially the sportsbook’s cut for facilitating bets. Typically ranging between 5% and 10%, this fee ensures the sportsbook profits no matter the outcome by embedding its margin into the odds.
Here’s how it works: With fair odds of 2.00, a $100 bet would yield a $200 payout (netting $100 in profit). But when a 5% vig is applied, the odds might drop to 1.90. This reduces the payout to $190, leaving you with just $90 in profit. As a result, the break-even probability increases from 50% (with fair odds) to about 52.6% when the vig is factored in.
Sportsbooks also adjust odds based on betting activity to maintain their profit margin. Even if you correctly estimate the likelihood of an outcome, the vig eats into your potential return. That’s why accounting for vig is crucial when assessing your edge.
Market Hold and Implied Probabilities
Market hold refers to the total vig built into a betting market. Because sportsbooks include their fee within the odds, the sum of all implied probabilities in a market usually exceeds 100%.
Take a simple two-way market with -110 odds on both sides. Each side has an implied probability of about 52.4%, which adds up to 104.8%. That extra 4.8% represents the sportsbook’s hold. In a perfect world without vig, the true probability for each side would be 50%.
To accurately calculate your edge, you need to strip out the vig. Comparing your true probabilities to the inflated implied probabilities without adjusting for vig can lead to underestimating your potential advantage.
In Step 3, we’ll cover how to calculate vig-free probabilities and uncover the fair odds that better reflect your betting edge. But first, let’s dive into building a true probability model to refine your calculations.
Step 2: Build or Use a True Probability Model
Once you’ve got a handle on how sportsbook odds work, the next move is estimating actual game outcomes. Instead of relying solely on the bookmaker’s numbers, you’ll need a true probability model built on clean, relevant data. This helps you move past gut instincts and public opinion to make more informed decisions.
Collect the Right Data
The foundation of any solid probability model is high-quality data. Start with historical game data - things like past results, final scores, total points, and moneyline outcomes. These provide a baseline for testing and refining your model. Add to that market odds data by tracking opening lines, closing spreads, and how these lines shift across various sportsbooks over time.
Don’t stop there. Team performance stats are essential too. Metrics like average points scored and allowed, win-loss records, and advanced stats like Expected Points Added (EPA), pace, neutral pass rate, and success rate can give you deeper insights - especially for NFL betting. If EPA data isn’t accessible, simpler stats like yards per play can still be useful. And don’t forget player-specific data, such as quarterback health or detailed injury reports, which can heavily influence outcomes.
You’ll also want to factor in situational elements - injuries, weather, scheduling quirks, and the game venue - all of which can sway results. Tracking betting volume, like the split between total cash wagered and the number of tickets placed, can reveal where sharp money is flowing.
A key rule here: only use data that was available before each game. This avoids "look-ahead" bias when backtesting models, ensuring your predictions are genuinely forward-looking. Also, clean your data thoroughly - standardize team names, headers, and date formats to keep things consistent.
With a clean and comprehensive dataset, you’re ready to move on to selecting a modeling method.
Pick a Modeling Method
The way you model probabilities will depend on the sport, the type of bet, and the data you’ve collected. Options range from simple probability calculations to more advanced machine learning techniques. Each bet type calls for a different focus: moneyline bets require win probability estimates, point spreads need predictions of median outcomes, and over-under totals often demand scoring quantiles.
One thing to prioritize is calibration - how well your predicted probabilities align with actual outcomes. Calibration directly affects profitability, so it’s more important than raw accuracy. For example, a 2022 NFL regression analysis showed that passing efficiency had the strongest impact on game outcomes.
Popular modeling methods include regression models that weigh various factors, efficiency rating systems that compare team strengths, and simulation-based approaches that run thousands of game scenarios. It’s smart to start with simpler models and only add complexity if it genuinely improves your predictions.
Once your model is calibrated, you can use specialized tools to take your probability estimates to the next level.
How WagerProof Helps Build Probability Models
WagerProof simplifies the process of building true probability models with tools like the Statistical Edge Finder, which gathers real-time stats and trends across multiple games. It brings together key metrics and situational factors in one place, saving you time and effort.
The platform’s AI Game Simulator runs advanced simulations to create probability distributions for different outcomes. This gives you a data-driven estimate to compare against sportsbook lines, whether you’re validating your analysis or starting from scratch.
Another handy feature is Live Prediction Markets Tracking, which monitors real-time odds movements for moneylines, spreads, and over-unders. By comparing these shifts to your probability estimates, you can spot when sportsbooks lag behind or when public betting creates inefficiencies. This feedback loop helps you fine-tune your model as new information rolls in closer to game time.
Step 3: Remove Vig to Calculate Fair Odds
When sportsbooks set odds, they include a built-in profit margin, often called the "vig." This ensures they make a profit no matter the outcome. Because of this, the total implied probabilities of all outcomes will exceed 100%. By removing the vig, you can uncover the fair odds, which reflect the actual likelihood of each outcome. These fair odds are crucial for accurately calculating expected value.
Adjusting for Vig-Free Implied Probabilities
First, convert the raw odds into implied probabilities as outlined in Step 1. Next, adjust these probabilities proportionally to remove the vig. For example, let’s say Ohio State is listed at -180 and Utah at +155. The implied probabilities for these odds are about 64.3% for Ohio State and 39.2% for Utah, adding up to 103.5%. That extra 3.5% represents the vig. To find the fair probabilities, divide each implied probability by 103.5% and multiply by 100. After this adjustment, Ohio State’s fair probability is approximately 62.1%, while Utah’s is 37.9%.
In a typical -110/-110 market, sportsbooks hold around a 4.8% edge. This means a bettor must win about 52.4% of their wagers just to break even. Removing the vig reveals the sportsbook’s true assessment of each outcome, giving you a clearer picture of the actual odds.
Comparing Fair Odds to Raw Odds
Fair odds show the real probability of an event occurring, while raw odds are inflated to secure the sportsbook's profit. This distinction is critical when evaluating your edge. For instance, if your model predicts a 65% chance of Ohio State winning, the raw implied probability of 64.3% might suggest only a slight edge. However, comparing your model to the vig-free probability of 62.1% reveals a more significant advantage of 2.9 percentage points. By eliminating the distortion caused by the vig, you can make sharper assessments and identify genuine betting opportunities.
How WagerProof Simplifies Vig-Free Calculations
WagerProof takes the guesswork out of removing the vig. Its tools automatically calculate vig-free probabilities using both real-time and historical odds. The Statistical Edge Finder retrieves current lines, adjusts for the vig, and compares the fair probabilities to your model’s estimates. This streamlined process helps you quickly identify where your edge lies without needing to crunch the numbers manually.
WagerProof also tracks how vig percentages vary across different sportsbooks and bet types. This insight allows you to pinpoint markets with smaller margins, offering better value. Whether you're analyzing moneylines, spreads, or totals, these tools save time and reduce the chance of errors, giving you an efficient way to refine your betting strategy.
Step 4: Calculate Edge and Expected Value (EV)
Once you've determined fair odds, the next step is to assess your edge - a percentage that reflects your potential profit relative to your stake.
How to Use the Edge Formula
A positive edge is the cornerstone of long-term betting success. Here's the formula:
Edge = (True Probability × Decimal Odds) – 1
Let's break it down with an example. Suppose you think the New York Yankees have a 60% chance of winning, and the sportsbook lists them at -120 odds. First, convert -120 to decimal odds (approximately 1.833). Then, plug the numbers into the formula:
(0.6 × 1.833) – 1 = 0.1, or 10%.
This means you have a 10% edge, which translates to an average profit of $12 per $120 bet.
While the edge formula shows your advantage as a percentage, Expected Value (EV) puts it in dollar terms. The EV formula is:
EV = (Probability of Win × Payout) – (Probability of Loss × Stake)
For instance, if you bet $20 on an NFL underdog at +150 odds with a 45% chance to win, the potential profit is $30. Using the formula:
(0.45 × $30) – (0.55 × $20) = +$2.50.
This result means your $20 bet has a 12.5% edge, or a $2.50 expected profit.
"Expected value is the truth serum for your bets – it reveals whether you're making a savvy play or donating to the sportsbook's coffers." – Jimmy Boyd, Boyd's Bets
Positive Edge vs. Negative Edge
A positive edge (+EV) occurs when your estimate of an outcome's true probability is higher than the sportsbook's implied probability. These bets are mathematically profitable over time, even if individual outcomes vary. Most sharp bettors typically work with small edges, often in the 1–3% range, but even modest advantages can lead to significant profits over time. For example, a 55% win rate - just 5% above the break-even point - can yield substantial gains.
On the flip side, a negative edge (-EV) happens when the sportsbook's implied probability exceeds your estimate. In such cases, the odds don't justify the risk, and these bets are likely to lose money in the long run. For instance, standard -110 odds require roughly a 52.4% win rate just to break even due to the vig. Betting below this threshold consistently will drain your bankroll over time.
WagerProof's Edge Finder Tool
To simplify these calculations, WagerProof's Statistical Edge Finder does the heavy lifting. It pulls real-time odds, adjusts for vig, and compares fair probabilities with your model's estimates, helping you identify wagers with positive EV quickly and efficiently.
Step 5: Use Edge to Manage Your Bankroll
Now that you've calculated your positive edge in Step 4, it's time to put that advantage to work through smart bankroll management. Knowing your edge is only part of the equation - your bet sizes need to align with it. The goal? Maximize growth while keeping risks in check.
Adjust Bet Sizes Based on Edge
To figure out how much of your bankroll to wager, many bettors turn to the Kelly Criterion. This formula helps you calculate the ideal fraction of your bankroll to bet: f = (bp - q) / b, where:
- f: Fraction of your bankroll to wager
- b: Decimal odds minus 1
- p: Win probability
- q: Loss probability (1 - p)
For example, research on 121,507 betting lines showed that using a Partial Kelly strategy with a 10% threshold resulted in an impressive 80% annual return over 11 years.
However, not everyone uses the full Kelly amount. Many experienced bettors prefer fractional Kelly, wagering 25–50% of the calculated amount to reduce volatility while still leveraging their edge. Another option is fixed-fraction betting, where you consistently bet the same percentage of your bankroll, regardless of edge size. This simpler method offers steadier growth and is easier to manage.
Once you've sized your bets appropriately, the next step is to keep track of your results. This is where the real learning happens.
Track and Record Your Results
For every wager, make sure to log the odds, your calculated edge, the outcome, and the bet size. Key performance metrics like ROI, closing line value, and win percentage will help you verify whether your edge estimates are accurate or need tweaking.
Regular reviews are essential. For instance, you might notice that you're consistently profitable with NFL underdogs but underperforming with NBA totals. By tracking results across large sample sizes and multiple seasons, you can account for variance and identify trends. Whether you use a basic spreadsheet or specialized software, the key is consistency.
WagerProof's Analytics and Reporting Tools
If manual tracking feels overwhelming, WagerProof can simplify the process. This platform automates your analytics, tracking everything from your betting history to actual ROI. It also compares your edge estimates with market movements, offering insights into your long-term profitability.
With its historical analytics, you can analyze performance by sport, bet type, or time period. The platform’s Edge Finder monitors how your projections stack up against closing lines - a crucial metric for success. Plus, WagerProof’s private Discord community provides benchmarks and shared insights, helping you validate your models and refine your strategy. Instead of relying on gut feelings, you’ll have real data to guide your decisions.
Conclusion
Turning sports betting into a disciplined, numbers-driven process requires mastering five interconnected steps: understanding odds and vig, creating accurate probability models, removing the house margin, calculating your edge and expected value, and managing your bankroll with precision.
Each of these steps builds on the others. For example, calculating your edge and managing your bankroll effectively both rely on a solid grasp of implied probabilities. When these elements align, betting becomes less about guesswork and more about a structured, analytical approach grounded in data and logic.
Successful betting also depends on consistent tracking, honest evaluations, and a willingness to adapt when the data suggests a change is needed. This kind of discipline ensures that your strategies remain grounded and responsive to real-world outcomes.
To simplify this process, WagerProof offers a platform that integrates all five steps seamlessly. With tools like the Edge Finder, AI Game Simulator, and automated analytics, WagerProof provides real-time insights and tracks historical performance. Its transparent approach ensures your decisions are backed by reliable data, not fleeting instincts. Plus, the private Discord community allows you to compare results and strategies with other dedicated bettors.
FAQs
How do I calculate the true probability of a sports event?
To figure out the true probability of a sports event, begin by diving into historical data. Look for patterns and trends that can shed light on team performance, player stats, and other key factors. Then, apply statistical models to estimate the likelihood of different outcomes based on this information.
Once you've calculated these probabilities, stack them up against the market odds. This comparison can help you spot discrepancies and identify where potential value bets might exist. By measuring these differences, you can calculate your betting edge, giving you a clearer path to make smarter choices.
Using tools like advanced analytics platforms can streamline this process. These platforms can offer deeper insights, making it easier to refine your betting strategies and approach decisions with confidence.
How can I calculate fair odds by removing the vig?
To figure out fair odds by stripping away the vig, the first step is to turn the given odds into implied probabilities. Once you have those, sum them up to determine the total market probability, which includes the bookmaker's margin (vig). Next, adjust each implied probability by dividing it by the total market probability - this normalizes the values. Finally, convert these adjusted probabilities back into odds. The result? Fair odds that reveal the true value of a bet without the bookmaker's built-in margin.
What is the Kelly Criterion and how does it help manage my betting bankroll?
The Kelly Criterion is a mathematical method designed to calculate the ideal bet size based on your perceived advantage and the odds at play. Its main goal? To help you grow your bankroll over the long term while minimizing the chances of wiping it out completely.
The formula works by scaling your bet size to match your edge - betting more when your advantage is greater and scaling back when it’s smaller. If you're concerned about managing swings in your bankroll, a fractional Kelly approach can be a smart way to dial down risk and make those fluctuations more manageable.
Related Blog Posts
Ready to bet smarter?
WagerProof uses real data and advanced analytics to help you make informed betting decisions. Get access to professional-grade predictions for NFL, College Football, and more.
Get Started Free