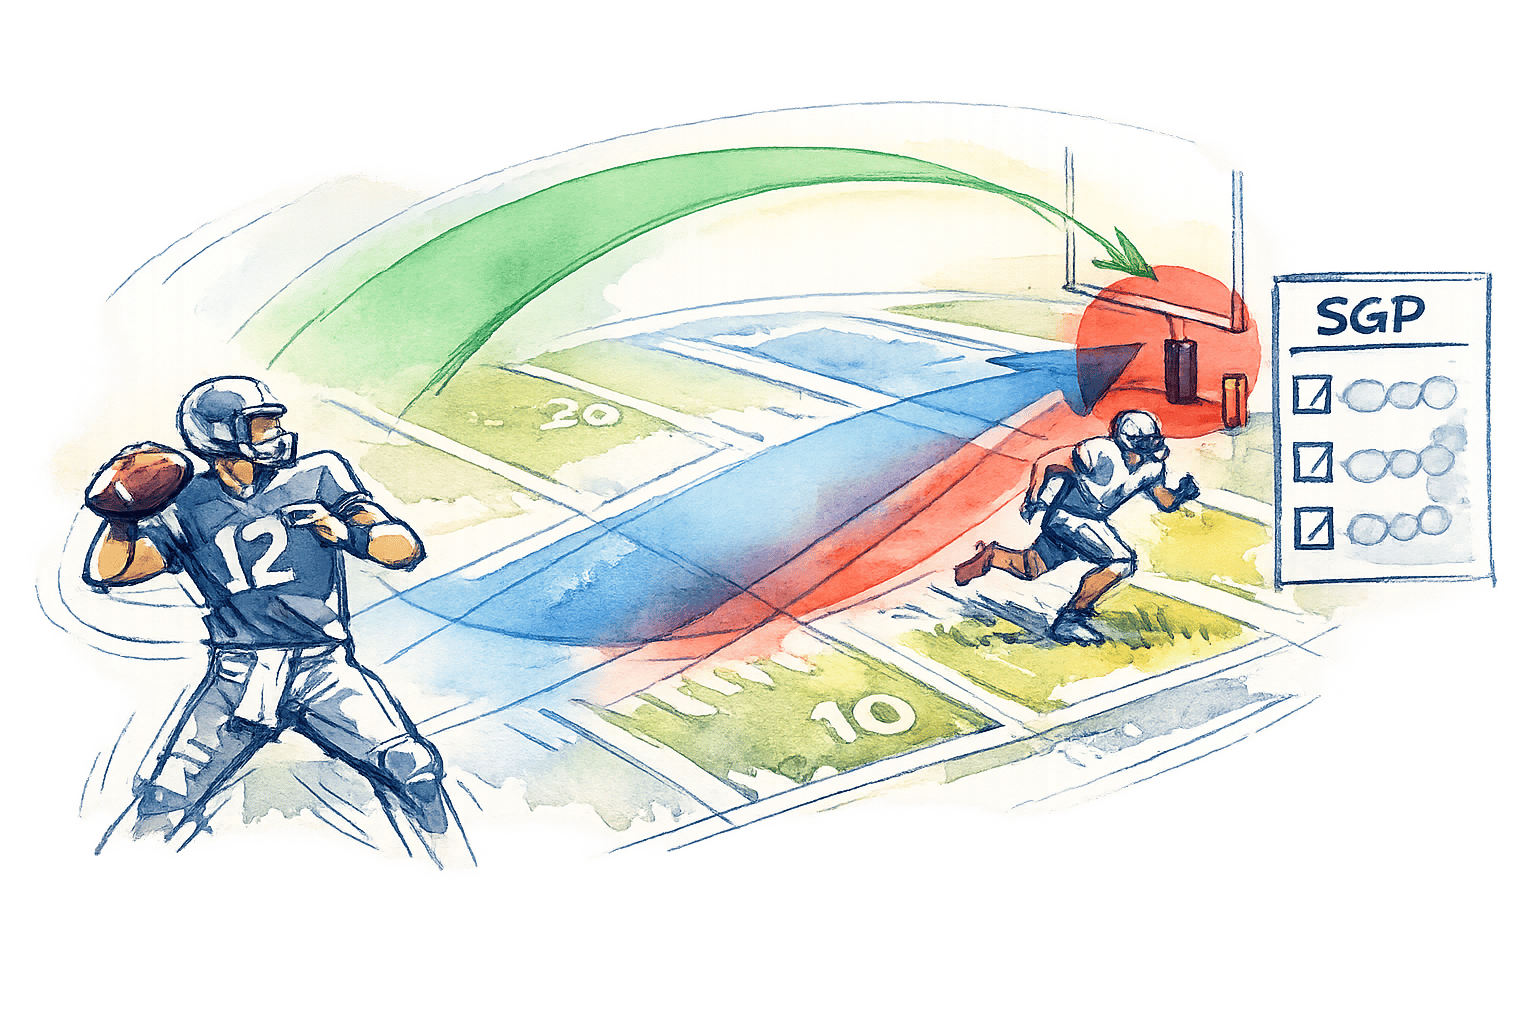
Correlation in Same-Game Parlays Explained
Same-Game Parlays (SGPs) let you combine related bets from a single game into one wager. These bets can be fun and offer higher payouts, but understanding correlation is key to making smarter decisions. Correlation in SGPs means that some outcomes within the same game are linked - for example, a quarterback throwing for 300+ yards increases the likelihood of their top receiver also exceeding 100 yards. Sportsbooks adjust payouts for these linked outcomes, applying a "correlation tax" that reduces your potential winnings.
Here’s what you need to know:
- Positive Correlation: Outcomes that are likely to happen together (e.g., QB passing yards + WR receiving yards).
- Negative Correlation: Outcomes that clash (e.g., RB rushing yards + QB passing yards on the same team).
- Sportsbook Adjustments: Odds are reduced for correlated bets to protect the sportsbook’s edge, with SGP house edges often exceeding 20%.
To improve your SGP strategy:
- Build bets around a logical game script.
- Avoid conflicting outcomes.
- Use tools like WagerProof to analyze correlations and find fair odds.
- Compare odds across sportsbooks for better payouts.
Positive and Negative Correlations Explained
Positive Correlation: When Outcomes Work Together
In the world of Same Game Parlays (SGPs), understanding how outcomes interact is essential, often requiring real-time sports data platforms to track shifting probabilities. Positive correlation occurs when one event increases the likelihood of another. For example, if a quarterback throws for over 300 yards, it’s more likely his top receiver will also rack up significant yardage - say, over 100 yards. This alignment supports a cohesive game script and improves your chances of hitting the parlay. Utilizing data-driven sports betting analytics can help identify these high-probability scripts before the lines move.
Take this: in the NFL, the connection between a quarterback’s passing yards and their WR1’s receiving yards typically ranges from 0.65 to 0.75. During the 2021 NFL season, when a team covered the point spread, the "over" on rushing yards props hit 56.0% of the time. But when the team failed to cover, that number dropped to just 30.6%.
Here’s where it gets interesting: a three-leg parlay with independent outcomes has a 16.0% chance of hitting. Add positive correlation, and that probability rises to 21.2%. That’s a 30% increase! However, sportsbooks account for this and offer reduced payouts on obvious combinations, like a quarterback and their primary receiver both going over, to balance the odds.
On the flip side, negative correlations can throw a wrench in your SGP plans.
Negative Correlation: When Outcomes Clash
Negative correlation happens when one outcome decreases the likelihood of another. For instance, betting on a team to win while also taking the "over" on the opposing running back’s rushing yards creates a clash in game scripts. While both outcomes are possible, they’re less likely to align.
The numbers back this up. In the 2021 NFL season, a parlay combining a team covering the spread with their quarterback going "over" on passing attempts hit just 17.3% of the time. Similarly, when a team covered the spread, the "over" on interceptions hit only 17.5% of the time. But if the team lost against the spread, that interception "over" jumped to 33.1%.
"Most SGPs fail not because the predictions are bad, but because the parlay is built to fight against itself." – StatsBench
Let’s break it down further. Pairing a running back’s "over" on rushing yards with the same team’s quarterback "over" on passing yards is a classic example of conflicting game scripts. High rushing totals often mean fewer offensive snaps for passing plays, making the two outcomes work against each other. Essentially, you’re betting on two scenarios that don’t align, which can sabotage your parlay before the game even begins.
How Sportsbooks Price Correlated Parlays
Correlation Pricing Methods
When it comes to pricing same-game parlays, sportsbooks rely on advanced mathematical tools to account for correlations between outcomes. One of the most common methods is the Pearson Correlation Coefficient, which measures the linear relationship between two outcomes on a scale from -1 to +1. For example, in the NFL, a quarterback's passing yards and a top receiver's receiving yards often show a correlation between 0.65 and 0.75.
Another approach is Gaussian Copula Modeling, which calculates joint probabilities by converting binary outcomes into continuous variables within a multivariate normal distribution. If historical data is plentiful, sportsbooks may also use Empirical Frequency Analysis, a method that analyzes historical game data to determine how often certain combinations occur.
Most sportsbooks combine these methods. They rely on historical data where available and turn to mathematical models like copulas to address less common or new betting combinations. Since 2019, major US sportsbooks have shifted from outright banning correlated bets to creating proprietary models that automatically price in a "correlation tax" to adjust odds.
How Correlation Affects Odds and House Edge
The correlation between bet legs directly impacts odds, allowing sportsbooks to maintain their margins. For example, a traditional three-leg parlay at -110 odds typically has a house edge of about 9%. However, for a same-game parlay, that edge can climb to between 15% and 25%. In fact, the average hold rate for same-game parlays often exceeds 20%, compared to just 5% for straight bets.
This increase is due to the "correlation tax", a reduction in payouts when the bet legs are related. By adjusting the odds to account for correlated outcomes, sportsbooks protect their profits.
"The gap between +596 and +350 is not random. It is the correlation tax: the discount sportsbooks apply when your bet legs are related to each other rather than independent." – OddsIndex
Here’s how the pricing works: sportsbooks first estimate the true probability of each individual leg. Then, they apply a correlation adjustment - using methods like copulas or empirical analysis - which could increase the joint probability by a factor of 1.35x for positively correlated outcomes. This adjusted probability is converted into odds that include a built-in house edge. Finally, sportsbooks make dynamic adjustments based on betting patterns.
Since sportsbooks have access to vast datasets that bettors do not, they can embed higher margins into their pricing. The result? Odds for the same same-game parlay can vary significantly across platforms, with one sportsbook offering +350 while another lists +420. This lack of transparency is intentional, but understanding these correlations can provide a savvy bettor with an edge that most others miss.
The Hidden Risk of Same Game Parlays: Why Positive Correlation Hurts Your Bets
How to Use Correlation to Find Value in Same-Game Parlays
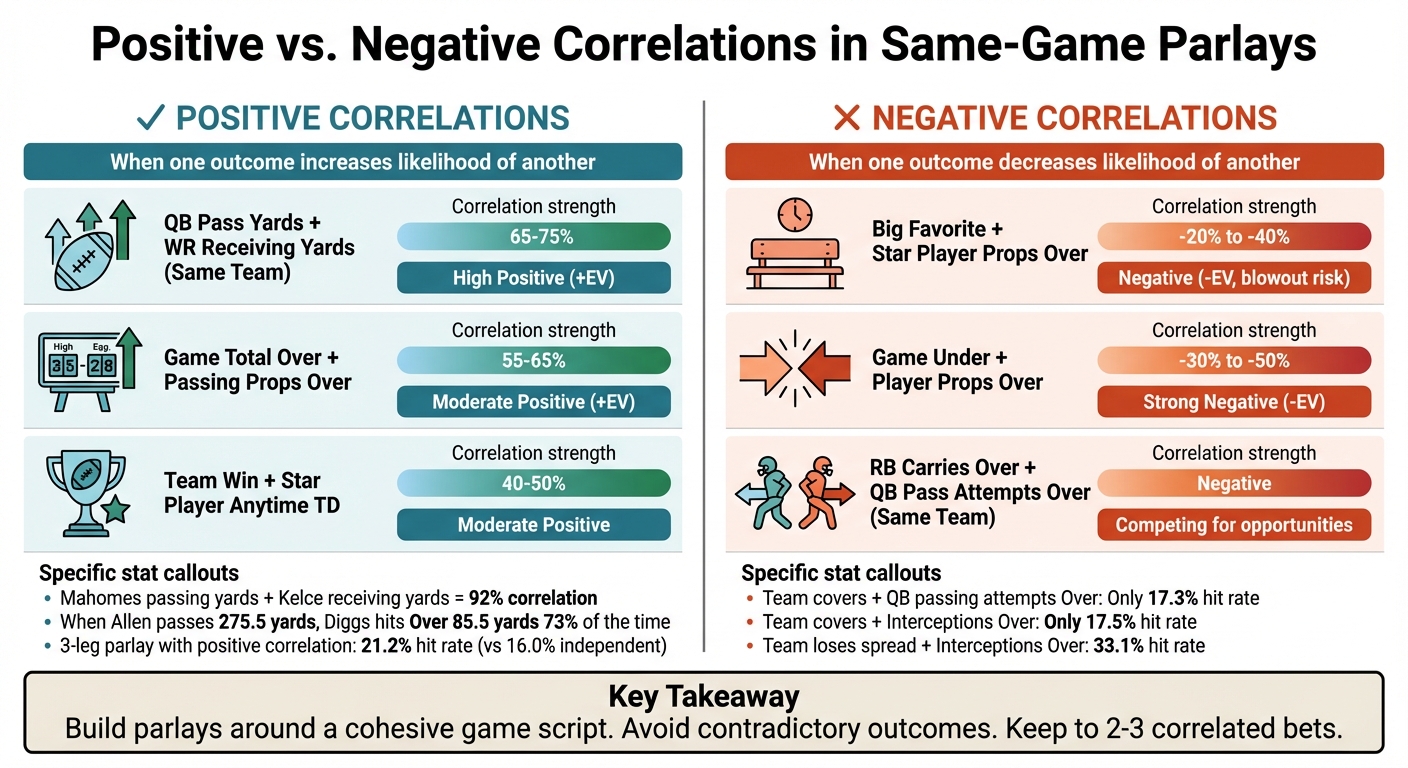
Positive vs Negative Correlation Examples in Same-Game Parlays
Positive vs. Negative Correlation Examples
To uncover value in same-game parlays, it's crucial to understand the difference between positive and negative correlations.
Positive correlations occur when one outcome increases the likelihood of another. For example, Patrick Mahomes' passing yards and Travis Kelce's receiving yards are strongly linked, with a 92% correlation coefficient according to some analytical tools. Similarly, when Josh Allen surpasses 275.5 passing yards, Stefon Diggs hits his Over of 85.5 receiving yards 73% of the time.
On the other hand, negative correlations reflect outcomes that work against each other. A classic example is pairing a running back's Over on carries with a quarterback's Over on pass attempts - these players are effectively competing for offensive opportunities. Another common trap is combining a big favorite (e.g., a spread of -10 or more) with Overs on star player props. If the game turns into a blowout, starters often sit out in the fourth quarter, derailing your bet.
| Bet Combination | Correlation Strength | Typical Verdict |
|---|---|---|
| QB Pass Yds + WR Rec Yds (Same Team) | 65–75% | High Positive Correlation (+EV) |
| Game Total Over + Passing Props Over | 55–65% | Moderate Positive Correlation (+EV) |
| Team Win + Star Player Anytime TD | 40–50% | Moderate Positive Correlation |
| Big Favorite + Star Player Props Over | -20% to -40% | Negative Correlation (-EV due to blowout risk) |
| Game Under + Player Props Over | -30% to -50% | Strong Negative Correlation (-EV) |
By recognizing these patterns, you can avoid common pitfalls and focus on combinations with higher potential value.
How to Identify Value in Correlated Parlays
Using correlation principles, you can refine your parlay strategy by building bets around a cohesive game script. For instance, if you anticipate a high-scoring shootout, consider pairing the Over on the favorite's quarterback with the Over on the opposing quarterback. A high-scoring lead often forces the trailing team into a pass-heavy comeback mode.
Avoid contradictory bets, such as combining a quarterback's Over on passing yards with his top receiver's Under. Instead, look for "glitches" - situations where the sportsbook's odds undervalue the true likelihood of correlated outcomes. For NBA bets, correlations between a star player's points and their team's win are strongest when the point spread is under 7 points.
Keep your parlay concise, with 2–3 correlated bets. Adding more legs increases the house edge and makes it harder to find favorable odds. Since same-game parlays are inherently high-variance, limit your stake to 0.5–1% of your total bankroll, even for bets with a positive expected return. Lastly, always compare odds across sportsbooks - payouts can differ by as much as 10–20%.
Using WagerProof Tools to Analyze Same-Game Parlay Correlations

WagerProof takes the basics of correlation analysis and turns it into a powerful toolkit for finding value in same-game parlays.
Real-Time Data and Prediction Markets
With real-time sports data and predictive models, WagerProof calculates what it considers a fair price for each leg of a parlay. The Edge Finder tool stands out by flagging discrepancies between sportsbook odds and true probabilities. For instance, if a sportsbook's parlay price is much higher than WagerProof's fair price, it could mean you're overpaying due to an inflated correlation tax on an obvious combination.
The AI Game Simulator adds another layer of precision by offering scenario-based probabilities tailored to current conditions. For example, if you're betting on a high-scoring game with multiple player Overs, this tool helps verify if your game script aligns with the probabilities. These real-time insights feed directly into interactive tools, making it easier to explore correlations in depth.
WagerBot Chat for Correlation Analysis
WagerBot Chat builds on this real-time data to give you instant correlation analysis. Want to know how Patrick Mahomes throwing for over 275.5 yards correlates with Travis Kelce catching over 85.5 yards? Just ask. WagerBot Chat uses live professional data to provide answers grounded in historical trends and current game dynamics. This interactive feature lets you experiment with parlay combinations before committing, helping you identify legs that work well together and avoid those that might clash.
Data-Driven Tools for Better Betting Decisions
WagerProof takes a multi-model approach to ensure transparency, showing the math behind each edge it identifies. The platform alerts you when betting lines deviate from actual probabilities, making it easier to spot negative correlations - outcomes that are unlikely to align. The Public Money Splits feature is another valuable tool, showing how ticket and money percentages differ. This can reveal when sharp bettors are going against public opinion on correlated parlays. Armed with these insights, you can focus on crafting parlays that are not only correlated but also offer solid value.
Conclusion
Grasping correlation can mean the difference between blindly placing bets and making well-informed choices in same-game parlays. Sportsbooks often impose steep taxes on positive correlations - leading to hold rates that can exceed 20%. On the flip side, negative correlations often hide opportunities that casual bettors tend to miss. The trick lies in knowing when you're overpaying for obvious combinations and when you're getting a fair deal on less apparent ones.
Manually calculating joint probabilities is unrealistic, but tools like WagerProof's Edge Finder, AI Game Simulator, and WagerBot Chat simplify these complex correlation models into actionable insights. To maximize your edge, shop around for the best lines across sportsbooks, leveraging differences in their pricing of correlated outcomes. Combine this with disciplined bankroll management - keeping same-game parlay wagers to just 0.5–1% of your total bankroll - to maintain a sustainable, high-variance betting strategy.
The best bettors steer clear of predictable "narrative stacks" and instead focus on mathematically sound, less obvious combinations. By targeting situations where the sportsbook's correlation tax doesn't reflect the true relationship between outcomes, as outlined in this guide, you can turn correlation analysis into a tool that works in your favor rather than the bookmaker's.
FAQs
How can I tell if two SGP legs are correlated?
To figure out if two same-game parlay (SGP) legs are linked, you can dive into their statistical relationship using tools like the Pearson correlation coefficient. This metric helps you see if the outcomes are positively correlated (more likely to occur together) or negatively correlated (less likely to happen at the same time).
Sportsbooks are aware of these correlations and often tweak payouts accordingly. However, if you spot correlations that seem stronger than expected, you might uncover opportunities where the odds are mispriced or offer better value.
Why do sportsbooks pay less on correlated SGPs?
Sportsbooks offer lower payouts on correlated same-game parlays (SGPs) because correlated events increase the chances of multiple outcomes occurring together, giving bettors an advantage. To counter this, sportsbooks adjust the payouts to reflect the higher probability of these combinations, often adding a hefty vig. This adjustment helps them protect their profits, even when bettors spot and leverage these correlations.
What’s the best number of legs for an SGP?
The sweet spot for the number of legs in a same-game parlay (SGP) lies between 2 and 3 legs. This range strikes a balance between potential returns and the risk you take on. Why? Because while adding more legs might seem tempting for higher payouts, it also increases the risk and compounds the house edge. By keeping your parlay within this range, you’re making a smarter, more calculated bet.
Related Blog Posts
Ready to bet smarter?
WagerProof uses real data and advanced analytics to help you make informed betting decisions. Get access to professional-grade predictions for NFL, College Football, and more.
Get Started Free