
How to Spot Outliers in Betting Markets
Outliers in betting markets are unusual patterns or discrepancies in odds, line movements, or betting activity that deviate from the norm. These anomalies often signal professional betting activity or market inefficiencies, offering opportunities for bettors to find value. Here's how to identify and act on them:
- Sharp Line Movements: Look for reverse line movements (odds shifting against public bets), line freezes, and head fakes that suggest sharp betting influence.
- Public Betting Imbalances: Compare ticket percentages (number of bets) with money percentages (total wagered). Large gaps often point to professional bets.
- Performance Deviations: Monitor player and team stats for trends not reflected in current odds, such as streaks or standout performances.
- Statistical Methods: Use tools like devigging (removing the bookmaker’s margin) and quantile analysis to calculate true probabilities and detect outliers.
- Real-Time Tools: Platforms like WagerProof can flag outliers by analyzing odds, betting trends, and public money splits in real time.
Key Signs of Outliers in Betting Markets
Sharp Line Movements
Line movements can tell you a lot about betting behavior. The most important shifts often happen close to game time, when sportsbooks raise their limits. This is when sharp bettors - those with expert knowledge and strategies - can significantly influence the market. Pay attention to reverse line movement (RLM), where the line shifts against public betting trends. For example, if 65% of bets are on the favorite, but the spread moves in favor of the underdog, that’s a sign of sharp action. Another tactic to watch for is head fakes, where small early bets are placed to nudge the line, followed by larger wagers on the opposite side. Line freezes - where odds stay static despite heavy betting on one side - are also worth noting.
"The consensus was that players found a consensus of action across several sites more accurate and more useful to their decision making." – Evan Kirkham, CEO, Outlier
Avoid chasing steam moves - those dramatic shifts in the line. By the time you notice them, the value is usually gone. However, if a line movement aligns with your own positive expected value (+EV) calculations, you might consider increasing your wager slightly, to about 1.25 or 1.5 units. After identifying sharp line movements, check for public betting imbalances to confirm if outlier activity is in play.
Public Betting Imbalances
Discrepancies between ticket percentage and money percentage can reveal where sharp bettors are placing their money. Ticket percentage reflects the number of bets placed, often dominated by casual bettors, while money percentage shows the total amount wagered, which typically includes larger bets from professionals. A useful metric is the "Pro Edge", calculated by subtracting ticket percentage from money percentage. A gap of 10% or more often signals professional betting activity. For instance, if the underdog gets only 35% of the tickets but 50% of the money, it’s a strong indicator that sharp bettors are backing the underdog with larger stakes.
These imbalances are especially telling in totals markets. The public tends to bet the Over, but if the Under attracts significant money despite low ticket volume, it could signal sharp action. Keeping an eye on these differences can help you spot outlier opportunities.
Performance Deviations
When teams or players perform outside their usual patterns, it can create valuable betting opportunities. Track individual player stats - like points, assists, or rebounds per game - against their season averages. If a player consistently outperforms their average over several games, it could indicate a potential edge. Similarly, look at team metrics such as unexpected winning streaks, scoring differentials, or head-to-head records. These trends might not be fully accounted for in the odds, giving you an advantage.
For example, monitoring unusual win/loss streaks or performance spikes can increase your potential returns by 5–10% per bet. However, it’s crucial to differentiate between short-term fluctuations and long-term trends. Identifying these patterns early can help you make smarter wagers.
Statistical Methods for Detecting Outliers
Using statistical methods takes the guesswork out of identifying outliers, offering a solid mathematical base for smarter betting decisions.
Devigging Odds to Calculate True Probabilities
Every sportsbook includes a built-in profit margin, often called the "vig" or overround, in their betting lines. Devigging strips away this margin to reveal the actual probabilities behind the odds. To start, gather odds from sharp sportsbooks - these are platforms where professional bettors influence prices, making them more reliable. Then, normalize these probabilities so they add up to 100%.
For symmetrical markets like point spreads and totals, the Probit method works best. For moneyline markets, where the favorite–longshot bias comes into play, the Shin method is more effective. These refined probabilities help you identify discrepancies between retail and sharp odds, guiding your betting choices.
Quantile Analysis for Historical Comparison
Once you've adjusted the odds, quantile analysis adds a historical layer to help you distinguish typical patterns from genuine outliers. Instead of relying on averages, this method examines specific percentiles - like the 10th, 50th, and 90th - to uncover details that averages might miss. Quantile regression is especially useful for spotting shifts in betting behavior at different levels of involvement. For example, at the highest engagement levels, relationships between variables like stake size and betting frequency can flip.
This approach is particularly effective in live betting markets where data tends to be skewed. In such cases, relying on averages alone might overlook critical outliers.
"Quantile regression provides a comprehensive account of the relationship between in-play betting behaviours capable of quantifying changes in magnitude and direction that vary by involvement." – Elsevier Ltd
Anomaly Detection with Statistical Models
Statistical models offer another layer of validation by flagging unusual patterns in real time. For example, Shin's Model is highly effective for calculating true probabilities as it adjusts for the favorite–longshot bias. A practical case: during the 2022 NFL season, one team's unusually high +10 turnover margin led to profitable betting adjustments when the trend eventually normalized.
To get the most accurate results, use the right devigging method for each market type. Probit works well for symmetrical spreads and totals, Shin is ideal for moneyline markets with bias, and multiplicative methods are suited for standard markets. By combining these models with real-time data, you can confidently act on anomalies and make informed betting decisions.
Tools for Real-Time Outlier Detection

Real-time tools are game-changers when it comes to spotting betting market outliers. By quickly analyzing data, they help you identify opportunities as they arise, turning raw numbers into actionable insights.
Using WagerProof for Outlier Alerts

WagerProof is a powerful tool that flags betting outliers by comparing public betting percentages with model confidence levels in real time. For instance, if there's a 37% discrepancy between the two, it might signal a possible value bet. The tool’s Fade Signals feature is particularly useful - it alerts you to significant imbalances, such as when public betting is at 65% but model confidence is only at 35%, pointing to a contrarian opportunity. WagerProof integrates with live game and odds feeds, quantifies betting edges, and even provides a WagerBot Chat feature to answer your betting questions using up-to-date professional data.
Comparing Odds Across Sportsbooks
Checking odds across multiple sportsbooks can uncover when one sportsbook deviates from the market. Start by applying your earlier devigging method to determine true probabilities, then compare these across books. A sportsbook offering odds that differ significantly could indicate either a pricing error or insider knowledge influencing the line. Tools like line movement charts can also help - these track how odds shift over time relative to betting percentages. Noticing reverse line movement (when the odds move against the majority of bets) often suggests sharp money is influencing the market. These comparisons make it clear why real-time alerts are essential for identifying opportunities.
Setting Up Data Tracking and Alerts
Once you've spotted discrepancies, automated tracking ensures you stay on top of changes without constant manual effort. Custom alerts can notify you of key shifts in odds or public betting percentages. For example, if both line movement and positive expected value (+EV) calculations confirm an anomaly, you might consider increasing your wager size to 1.25 or 1.5 units instead of your standard bet size. A centralized dashboard can help you review historical trends, fine-tune your alert thresholds, and act quickly when genuine opportunities arise.
Step-by-Step Guide to Finding and Using Outliers
Step-by-Step Guide to Detecting Outliers in Betting Markets
Collect and Analyze Data
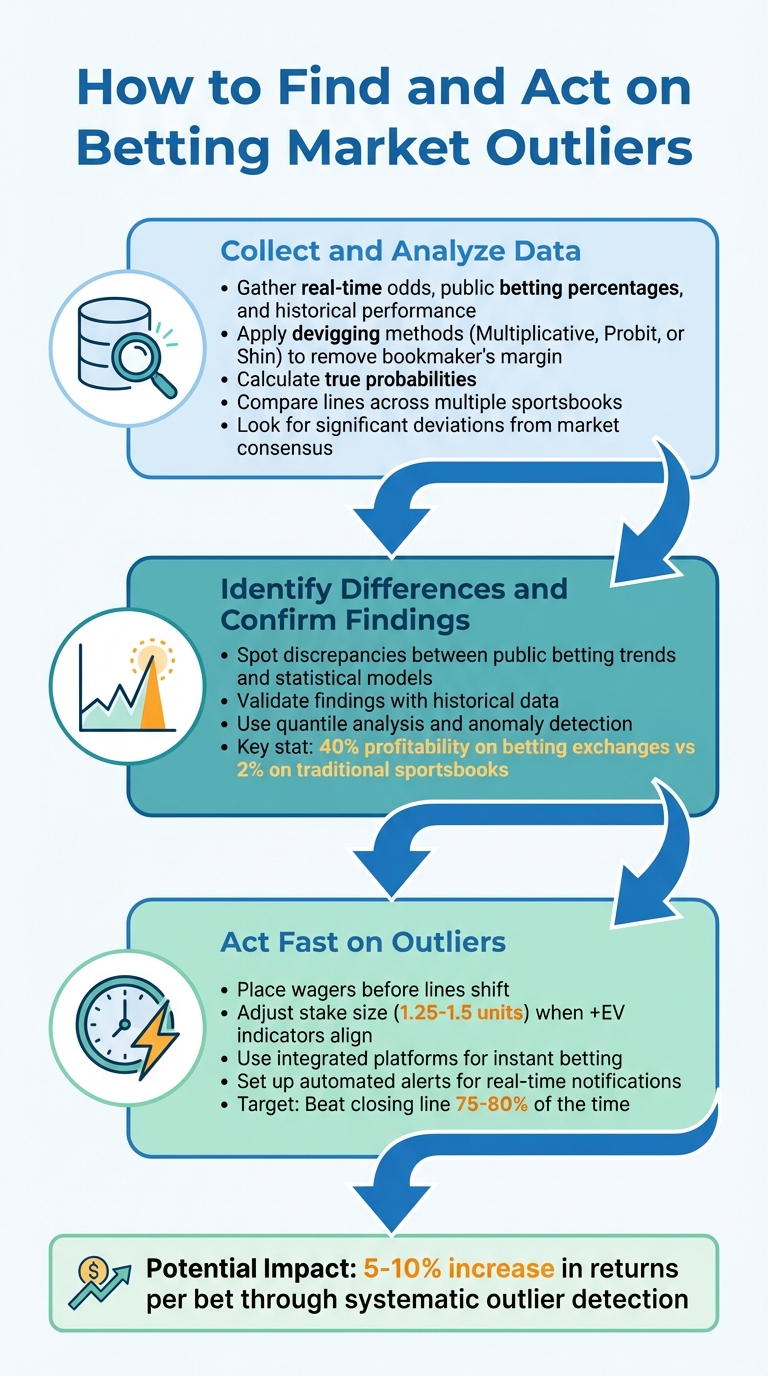
Start by gathering essential data like real-time odds, public betting percentages, and historical performance records. Use techniques such as Multiplicative, Probit, or Shin methods to devig the odds - this means removing the bookmaker's margin to uncover true probabilities. Once you’ve calculated these true probabilities, compare them across multiple sportsbooks. Look for lines that deviate significantly from the market consensus. These differences can often hint at potential opportunities, setting the groundwork for deeper analysis.
Identify Differences and Confirm Findings
Next, focus on spotting discrepancies between public betting trends and your statistical models. For instance, if public betting heavily favors one outcome but your true probabilities suggest a more balanced scenario, you might have found an outlier worth exploring. To validate these findings, compare them with historical data and insights from techniques like quantile analysis or anomaly detection. It’s worth noting that betting exchanges report a 40% chance of users being profitable, compared to just 2% with traditional sportsbooks. This highlights the importance of identifying and acting on such anomalies.
Act Fast on Outliers
Once you’ve confirmed an outlier, timing becomes critical. Betting markets adjust quickly as informed bettors act, so placing your wager before the line shifts is key. If line movements and positive expected value (+EV) indicators align, you may want to adjust your stake size based on your overall betting strategy. Using integrated sportsbook platforms can help you place bets instantly. To stay ahead, set up automated alerts that notify you as soon as your criteria are met.
Conclusion: Using Outlier Detection for Better Betting
Identifying outliers is all about spotting market inefficiencies before they disappear. By tracking statistical anomalies and acting on them strategically, you could boost your earnings by an estimated 5% to 10% per bet. Over time, these small advantages add up, turning your betting strategy into a methodical value-driven approach rather than a game of chance.
Peer-to-peer exchanges often deliver better returns, highlighting the importance of proactive outlier detection. These platforms emphasize the need for real-time tools to seize fleeting opportunities.
WagerProof makes this process easier by automatically identifying outliers and value bets through features like the Edge Finder, AI Game Simulator, and Public Money Splits. It pinpoints spread mismatches, contrarian indicators, and consensus gaps in real time. Instead of vague recommendations, it offers clear, actionable data backed by transparent insights.
As discussed earlier, combining techniques like devigging, anomaly detection, and real-time monitoring helps eliminate the bookmaker's margin, uncover true probabilities, and act quickly on significant deviations. While professional bettors aim to beat the closing line about 60-70% of the time, leveraging tools like line movement data and outlier detection can push that success rate even higher, potentially reaching 75-80%.
To maintain consistency, incorporate these methods into your daily routine. Automated alert systems can streamline your process, whether you're fading unsustainable trends or tracking sharp money movements. Timing is critical - markets shift fast, so act quickly when your alerts meet the criteria. With the right tools and a disciplined approach, outlier detection moves from being just a concept to becoming a core part of your betting strategy.
FAQs
How can I tell a real sharp move from a head fake?
A real sharp move happens when there are consistent and noticeable drops in odds, driven by large, informed bets. These moves often go against public sentiment and are backed by professional money. Key indicators include reverse line movement, high betting volume, and odds shifts that align with insider knowledge.
On the other hand, head fakes are temporary and superficial changes. They’re typically the result of public bias or smaller, uninformed wagers, lacking the weight of professional backing.
What’s the quickest way to devig odds and find +EV?
To spot +EV bets efficiently, start by converting sportsbook odds into fair probabilities by removing the vig. Then, compare these adjusted probabilities to your own estimates. Tools such as WagerProof simplify this process by automatically flagging outliers and potential value bets. You can also use statistical approaches, like multiplicative or additive models, to pinpoint mispriced markets - situations where your probability estimate is higher than the sportsbook's implied probability.
How should I set alerts so I don’t chase steam?
To avoid wasting time on fleeting trends, keep an eye on real-time market changes and set up alerts for notable reverse line movement (RLM) or situations where public money and betting volume differ by more than 10%. Pay attention to high betting volumes, sudden odds changes, and timing spikes, as these can signal sharp action. Tools like WagerProof can simplify the process by automating alerts, allowing you to respond to critical market shifts without getting distracted by minor changes or last-minute adjustments.
Related Blog Posts
Ready to bet smarter?
WagerProof uses real data and advanced analytics to help you make informed betting decisions. Get access to professional-grade predictions for NFL, College Football, and more.
Get Started Free