
Team Stats for Sports Betting Models
When betting on sports, relying on team statistics instead of gut feelings can help you make smarter decisions. Team stats highlight patterns and performance trends, offering insights that sportsbooks and the public often overlook. Metrics like Expected Goals (xG), Offensive Efficiency, and Adjusted Defensive Ratings give a clearer picture of a team's strengths and weaknesses, especially when accounting for opponent quality and pace.
Key Takeaways:
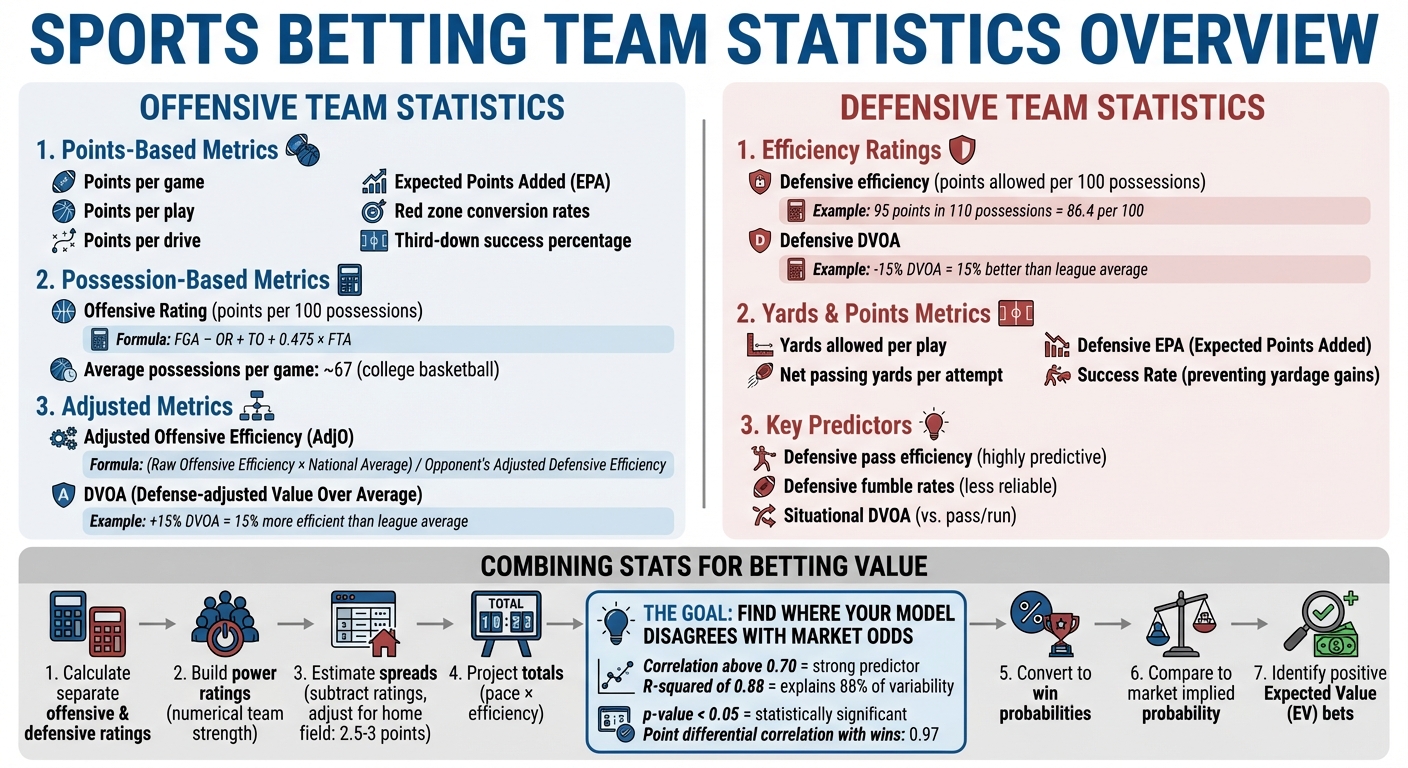
- Offensive Metrics: Points per play, Expected Points Added (EPA), and red zone efficiency show scoring effectiveness.
- Defensive Metrics: Yards per play, Defensive EPA, and Success Rate reveal vulnerabilities.
- Adjustments Matter: Stats adjusted for opponent quality, like Adjusted Offensive Efficiency or DVOA, provide better context.
- Predictive Modeling: Combining offensive and defensive stats into power ratings helps identify value bets where your model disagrees with sportsbook odds.
The goal is to find mismatches between your data-driven predictions and the market's implied probabilities. By focusing on efficiency, opponent strength, and pace, you can refine your betting approach and improve long-term results.
Key Offensive vs Defensive Metrics for Sports Betting Models
Offensive Team Statistics for Betting Models
Points-Based Metrics
One of the simplest ways to measure offensive performance is points per game. While it's a good starting point, refining your analysis with metrics like points per play and points per drive provides a clearer picture of scoring efficiency. These metrics go beyond raw totals and highlight how effectively a team capitalizes on its opportunities.
Expected Points Added (EPA) is another key tool that evaluates the value of each play by factoring in field position and the game situation. For example, a 5-yard gain on 3rd-and-3 has a much greater impact than the same gain on 3rd-and-10. Similarly, metrics like red zone conversion rates and third-down success percentages reveal how well a team performs in critical situations.
"Analytics can uncover these hidden advantages, which may influence betting lines and trends in unpredictable ways."
– Chris Bates, Author, On Pattison
These detailed stats can help you uncover betting opportunities. For instance, a team scoring 28 points per game might appear dominant, but if their red zone conversion rate is under 50%, they could be leaving points on the table. This inefficiency might make them vulnerable against teams with stronger defenses.
To get a fuller picture of offensive performance, you also need to consider metrics that account for pace.
Possession-Based Metrics
Raw point totals can be misleading if you don't account for pace. Offensive Rating (or Offensive Efficiency) measures points scored per 100 possessions, offering a more balanced view of a team's performance. For example, in college basketball, the average game features about 67 possessions per team.
"When two teams play each other, they are guaranteed to have the same number of possessions... So it doesn't matter what they do per game - only per possession."
– Cleaning the Glass
To calculate possessions in basketball, use the formula:
FGA – OR + TO + 0.475 × FTA.
Understanding pace allows you to estimate the total possessions in a matchup, which is especially important when betting on over/under totals. Games featuring two fast-paced teams are likely to generate more scoring opportunities, potentially driving the total points higher.
However, these metrics are only as good as the context you apply to them, which brings us to opponent strength.
Adjusting for Opponent Strength
Raw stats can paint a skewed picture if you don’t consider the quality of the opposition. A team averaging 30 points per game against weak defenses doesn’t compare to one scoring 27 points per game against top-tier defenses. This is where adjustments come into play.
Adjusted Offensive Efficiency (AdjO) estimates how a team would perform against a league-average defense at a neutral site. The formula is:
(Raw Offensive Efficiency × National Average Efficiency) / Opponent's Adjusted Defensive Efficiency.
"Any time you see something 'adjusted' on this site, it refers to how a team would perform against average competition at a neutral site."
– Ken Pomeroy, Founder, KenPom.com
In the NFL, metrics like DVOA (Defense-adjusted Value Over Average) go even further by comparing each offensive snap to the league average while accounting for down, distance, and opponent strength. For example, a team with a +15% DVOA is 15% more efficient than the league average after factoring in competition.
These adjustments ensure your analysis reflects true performance, helping you make more informed betting decisions.
Use NFL statistics to make informed sports betting decisions | Stathead Football Webinar
Defensive Team Statistics for Betting Models
Understanding defensive stats is just as important as offensive metrics when building betting models. Defensive numbers can uncover weaknesses that might influence the outcome of a game, giving you a clearer picture of where opportunities lie.
Defensive Efficiency Ratings
Defensive efficiency measures how many points a team allows per 100 possessions. By removing the influence of game pace, this stat offers a more accurate look at defensive performance. For example, consider a team that gives up 95 points in a fast-paced game with 110 possessions (86.4 points per 100). That performance is better than a team allowing 88 points in a slower game with only 85 possessions (103.5 points per 100).
However, raw efficiency numbers only tell part of the story. Adjusting for the quality of opponents helps reveal a team's actual defensive strength.
"The purpose of this system is to show how strong a team would be if it played tonight, independent of injuries or emotional factors."
– Ken Pomeroy, Creator of KenPom Ratings
In football, Defense-adjusted Value Over Average (DVOA) takes this concept further by evaluating each play in context - considering down, distance, field position, and opponent strength. A defensive DVOA of -15% means the defense is 15% better than the league average. This stat shines in low-scoring games, where a single defensive stop can change the outcome.
Beyond efficiency, other metrics help paint a fuller picture of defensive performance.
Opponent Yards and Points Metrics
Total yards allowed can sometimes be misleading. A defense might give up 400 yards but still dominate if those yards come during non-critical moments. A better indicator is yards allowed per play, which adjusts for the number of plays run.
For football betting models, net passing yards per attempt (factoring in sack yardage) is one of the most predictive stats. In 2009, analyst Brian Burke used a logistic regression model to predict Super Bowl XLIII. By inputting Pittsburgh's defensive net passing efficiency (4.3 yards per attempt) and rushing efficiency (3.3 yards per attempt) alongside Arizona's offensive stats, the model gave the Steelers a 72% win probability.
Another key metric is Defensive EPA (Expected Points Added), which measures how much a defense reduces an opponent's scoring chances per play.
"EPA knows that all turnovers aren't created equal... a Hail Mary interception at the end of the half from midfield is not nearly as penalizing [as one at midfield on 1st-and-10]."
– Alok Pattani, ESPN Stats & Information Group
When estimating game totals, comparing defensive efficiency ratings for both teams can help predict the number of possessions and points per possession. Games featuring strong defenses and slower offensive tempos often lead to lower overall scores.
These metrics - yards per play and EPA - are essential for spotting defensive vulnerabilities.
Finding Defensive Weaknesses
Not all defensive stats are equally predictive. For example, defensive pass efficiency is a reliable indicator of win probability, while defensive fumble rates tend to be inconsistent and more dependent on the offense's mistakes than defensive skill.
Success Rate - the percentage of plays where the defense prevents the offense from gaining enough yardage based on the down - highlights consistency and coaching effectiveness. Teams that consistently force third-and-long situations gain a sustained defensive edge.
To find exploitable weaknesses, analyze defensive DVOA by specific situations. A team might appear average overall but struggle against the pass while excelling at stopping the run. This creates betting opportunities when such a team faces a pass-heavy opponent.
"DVOA is arguably the best at-a-glance way to see how good teams genuinely are. DVOA is demonstrably more accurate at explaining past performance and predicting future success."
– Jason Logan, Senior Betting Analyst, Covers
Finally, look for teams whose EPA per play significantly differs from their win–loss record. Such mismatches can signal that a defense is either overperforming or underperforming relative to its actual skill level. These gaps often reveal where betting markets may have mispriced outcomes, giving you an edge in refining your models.
Connecting Stats to Game Outcomes
Once you’ve gathered offensive and defensive metrics, the next challenge is figuring out which stats actually matter for predicting game results. Not every number on the stat sheet is useful - focus on those that have been shown to correlate strongly with winning.
Selecting Relevant Statistics
A great place to start is with point or run differential. Across many sports, these metrics are some of the most reliable indicators of success. For example, a 2018 Yale University study analyzing 10 NBA seasons found that point differential had an almost perfect correlation (0.97) with win percentage.
In baseball, run differential is similarly powerful, explaining about 88.62% of the variability in a team’s winning percentage. Meanwhile, a 2022 study by Isabel Pantle from Dartmouth Sports Analytics used logistic regression on 2020 NFL data. Her model, which combined yards gained, yards allowed, and turnover differential, predicted 132 out of 150 games in the 2021 season - an accuracy rate of 88%. By contrast, using just yards gained had a pseudo R² of only 0.06594, showing how much stronger predictions become when combining multiple metrics.
"Using stats is like being a detective: you gather clues that others overlook. Advanced stats help you peek under the hood of team performance."
– Jimmy Boyd, Sports Handicapper
When building models for specific betting markets, it’s important to align your statistics with the outcomes you’re trying to predict. For totals, focus on pace-adjusted metrics like possessions per game and points per possession. For spreads, efficiency differentials - how much better one team performs than another - are key. And for moneylines, prioritize stats that directly influence win probability, such as turnover differential in football or three-point shooting percentage in basketball. Once you’ve chosen your stats, test their predictive strength to ensure they’re worth using.
Validating Stats with Data
After identifying relevant statistics, the next step is validating their predictive power. One common tool is Pearson’s correlation coefficient, which measures the strength of a relationship on a scale from -1.0 to 1.0. The closer the value is to 1.0, the stronger the positive correlation. A correlation above 0.70 is considered strong, while values below 0.30 are weak.
For continuous outcomes like point spreads or game totals, linear regression is a useful method. The key metric here is R-squared, which shows how much of the outcome variability your model explains. For example, an R-squared of 0.88 means your model accounts for 88% of the variability. For binary outcomes like predicting wins or losses, logistic regression is the better option, as it calculates the probability of a win based on specific variables.
In the Yale study, researchers used best subsets regression to test different combinations of NBA statistics. They found that a model relying solely on point differential was nearly as accurate as more complex models with multiple variables. Plus, it was easier to maintain.
It’s also important to check p-values to ensure your findings aren’t just random noise. A p-value under 0.05 is generally considered statistically significant, meaning there’s less than a 5% chance the results occurred by accident. The Yale point differential model, for instance, had a p-value of less than 2.2e-16 - essentially zero - proving its reliability.
To avoid overfitting your model, use walk-forward validation. This involves training your model on one set of data (like Weeks 1–8) and testing it on a later set (Weeks 9–12). This method replicates real-time betting conditions and prevents "look-ahead" bias. For situational factors like back-to-back games, isolate those scenarios in your data and analyze metrics like the "Against The Spread" margin to see if teams consistently underperform market expectations. Quantify elements like fatigue to gain a measurable edge.
Adding Team Statistics to Betting Models
Once you've figured out which stats truly matter, the next step is weaving them into a functional model. This involves merging offensive and defensive metrics to create team ratings, using those ratings to predict game outcomes, and then comparing your projections with sportsbook odds. Below, we’ll dig into how to bring these elements together effectively.
Combining Metrics for Game Projections
Start by calculating separate offensive and defensive ratings for each team instead of relying on one overall score. This approach helps pinpoint specific mismatches - like a strong offense going up against a struggling defense - that might otherwise get overlooked.
Next, build power ratings, which assign a numerical value to each team’s overall strength. To estimate a neutral-site spread, subtract the underdog’s rating from the favorite’s. For example, if the difference is 5 points, the spread would be -5. Adjust this baseline for factors like home-field advantage (typically worth 2.5 to 3 points in the NFL), injuries, and rest disadvantages.
When projecting totals, focus on pace and efficiency. For instance, in basketball, you’d multiply each team’s pace factor by their offensive and defensive efficiency ratings to estimate the combined score. In football, weather conditions like wind and rain can significantly impact scoring and should be factored into your calculations.
Once you’ve created these game projections, the next step is to compare them to the market odds.
Comparing Model Outputs to Market Odds
With your projections in hand, it’s time to see how they stack up against the odds offered by sportsbooks. Convert your game projections into win probabilities using logistic and Poisson methods, which can help estimate how much the actual score might differ from your prediction. Then, compare these probabilities to the market's implied probability. For example, if the sportsbook offers -110 odds on a spread, the implied probability is about 52.4%. You can calculate the "fair" probability by dividing each outcome’s implied probability by the total of both outcomes’ probabilities.
Here’s where expected value (EV) comes in. Positive EV means your model suggests a higher chance of success than the market indicates, signaling a potential opportunity for profit. Tracking your bets against the closing line - the final odds right before the game starts - can help you measure your model’s accuracy. If you consistently beat the closing line, it’s a strong sign that your model is working.
"You don't need to predict perfectly - you need to know where the price is wrong." – PerformanceOdds
Using WagerProof for Data and Insights

To keep your model accurate and up-to-date, having access to reliable data is critical. WagerProof offers pro-level betting data in one easy-to-use platform, including historical stats, public betting percentages, and automated alerts when market spreads don’t align.
Instead of juggling multiple sources, WagerProof flags outliers and value bets for you automatically. It also highlights situations where sharp money - bets from professional gamblers - diverges from public opinion, giving you a clearer picture of market inefficiencies.
Additionally, WagerBot Chat, WagerProof’s AI assistant, connects to live data and provides accurate stats on demand. You can ask it to pull specific team metrics, compare your model’s predictions to current odds, or analyze past matchups. On top of that, the platform’s exclusive Discord community connects you with Real Human Editors who share expert picks along with detailed reasoning. This helps you understand why certain bets have value, so you can refine your approach over time.
Conclusion
Creating a sports betting model based on team statistics isn't about nailing every game prediction - it's about finding where the market gets it wrong. Team stats provide insight into a team's true performance, going beyond just wins and losses.
Efficiency matters more than raw numbers. For example, a high scoring average might look impressive, but it can be misleading if it's the result of a fast pace against weak defenses. Metrics like points per possession, expected goals per shot, and opponent-adjusted stats help cut through the noise, offering a clearer picture of sustainable performance. Similarly, accounting for the strength of opponents is critical - gaining 400 yards against a top-tier defense is far more telling than doing the same against a struggling team.
This level of analysis helps uncover betting opportunities where the odds don't match reality. By combining offensive and defensive metrics into power rankings and game projections, you can build a system to identify value. For instance, if your model suggests a team should be favored by 5 points but the market only gives them a 2.5-point edge, you've likely found a spot worth betting on. The aim isn't to win every single wager but to consistently bet when your calculated probabilities diverge from the sportsbook's implied odds. Over the course of 100–300 bets, this disciplined approach can help overcome variance and deliver positive outcomes.
"Stats tell likelihood, Odds tell price, Predictions tell probability. Bet only when all three align." – Performance Odds
FAQs
How do adjusted statistics make sports betting predictions more accurate?
Adjusted statistics improve sports betting predictions by factoring in elements like game pace, the strength of opponents, and specific scenarios such as blowouts or foul trouble. By normalizing these stats, you gain a more accurate view of team and player performance, which can lead to better-informed predictions.
This method helps filter out irrelevant data, allowing your models to concentrate on meaningful patterns instead of random anomalies. Using adjusted stats in your analysis can make your betting decisions more precise and consistent.
Why is Expected Points Added (EPA) important for sports betting models?
Expected Points Added (EPA) is a metric that evaluates how much each play contributes to a team's overall score. It's a powerful way to assess team performance by quantifying the impact of individual plays. For bettors, this means spotting trends and fine-tuning betting models to improve prediction accuracy.
EPA is especially helpful for analyzing offensive and defensive efficiency. By comparing these aspects, bettors can identify potential advantages in matchups and make more informed, data-backed decisions.
Why does pace matter when analyzing team stats for sports betting?
Pace plays a key role in basketball because it directly affects how quickly a team moves through possessions, which in turn impacts the number of scoring opportunities during a game. When you account for pace, you can adjust team statistics like offensive and defensive efficiency. This adjustment makes it easier to compare teams with vastly different playing styles - whether they thrive in fast, high-scoring games or prefer a slower, calculated approach.
Pace also reveals valuable matchup insights. For instance, when a fast-paced team goes up against a slower, defense-focused squad, it can create interesting dynamics that might influence the outcome. Including pace in your analysis helps you make sharper predictions and more informed betting decisions.
Related Blog Posts
Ready to bet smarter?
WagerProof uses real data and advanced analytics to help you make informed betting decisions. Get access to professional-grade predictions for NFL, College Football, and more.
Get Started Free