10 Tips for Using Public Money Data in Betting
Public money data can reveal where casual bettors and professional sharps are placing their bets, offering insights to improve your betting strategy. By analyzing discrepancies between bet percentages (number of individual bets) and money percentages (total dollars wagered), you can identify sharp action and avoid common public betting pitfalls. Key takeaways:
- Bet Percentage vs. Money Percentage: Look for gaps of 10%+ - a sign of sharp money.
- Sharp Money Indicators: Small bet percentage but large money percentage often signals professional bets.
- Reverse Line Movement: When the line moves against public bets, it may indicate sharp action.
- Focus on High-Volume Games: Popular games provide more reliable data.
- Avoid Heavy Public Favorites: Betting against public trends can uncover value.
Tools like WagerProof simplify tracking public money trends, reverse line movement, and sharp action, helping you make informed decisions. For example, in the 2025 NFL season, sharp bettors outperformed the public in head-to-head matchups (14-8 vs. 8-14). Combining public data with tools like live updates and AI predictions ensures smarter betting choices.
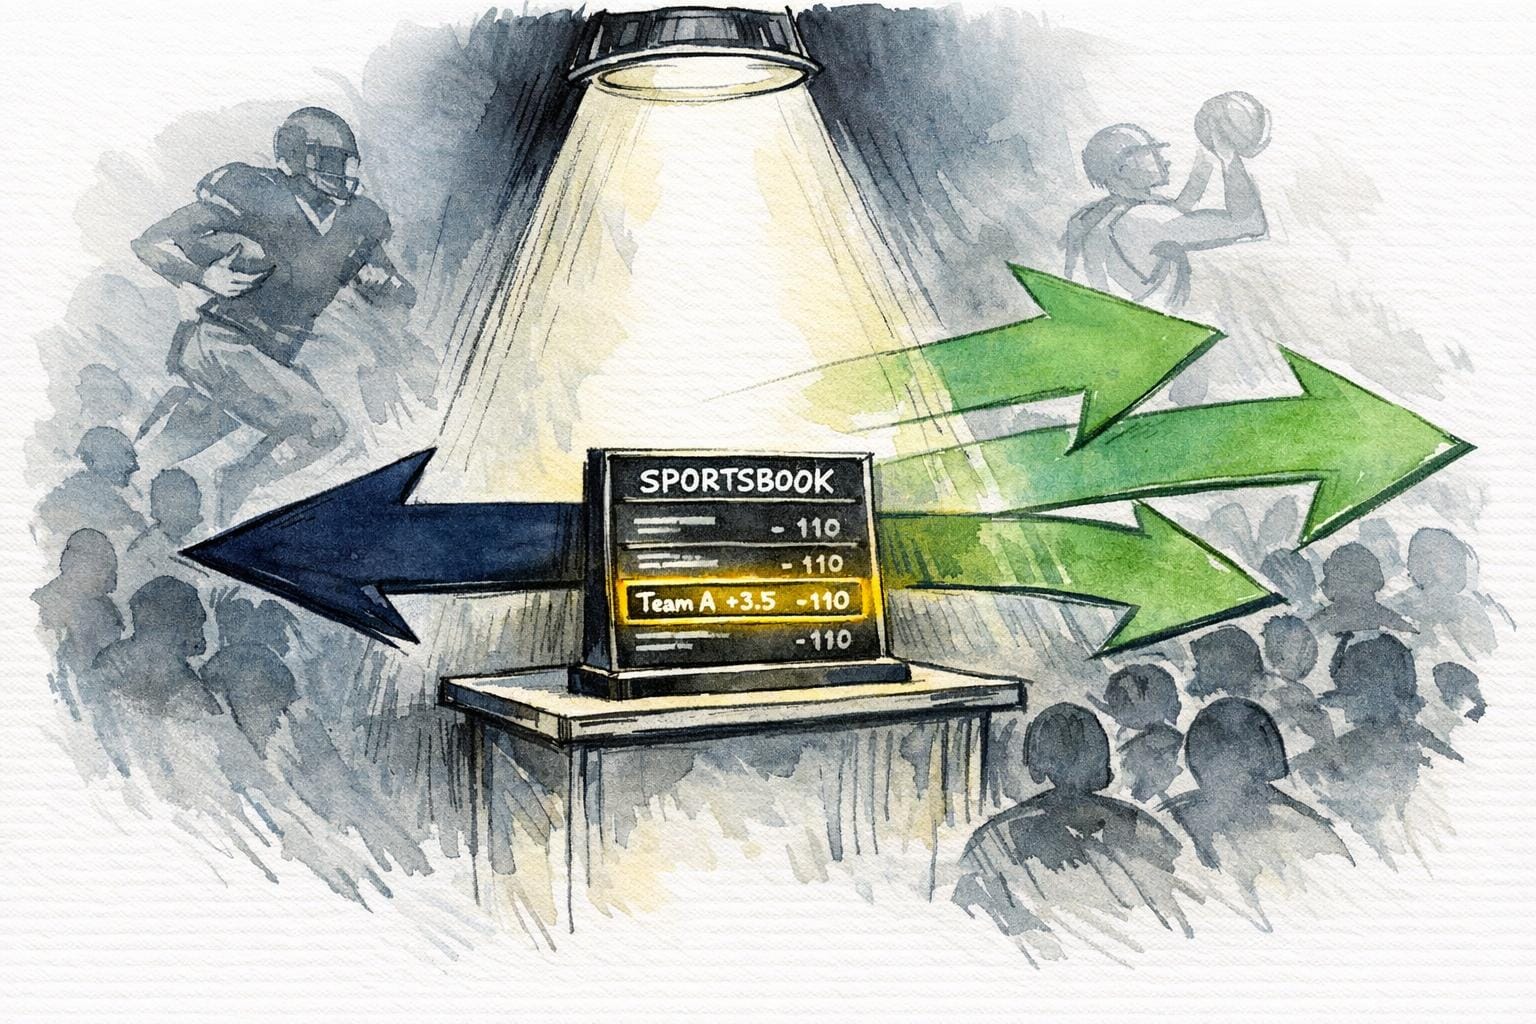
Bet Percentage vs Money Percentage: Understanding Sharp vs Public Betting
What is Reverse Line Movement and Public Betting Percentages? | Sports Betting 102
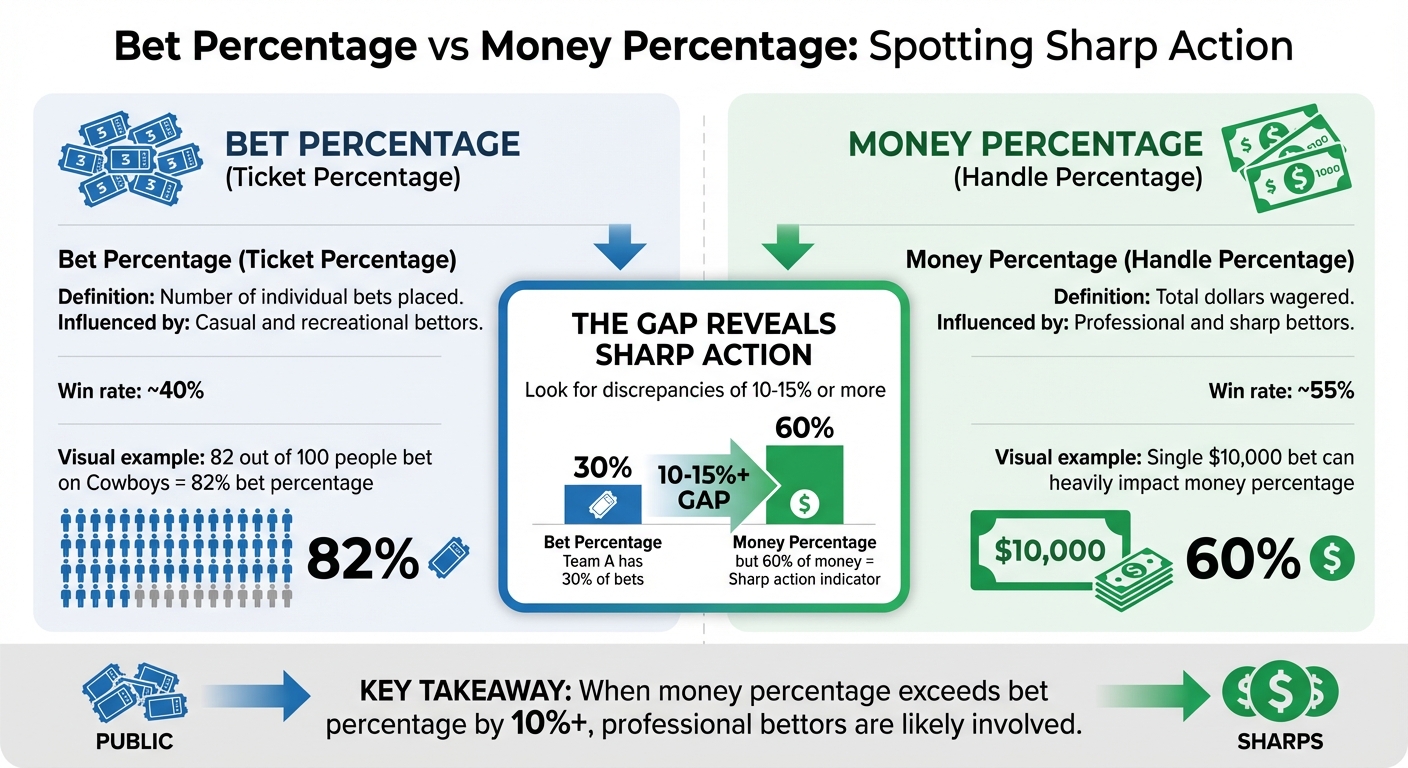
1. Know the Difference Between Bet Percentages and Money Percentages
Bet percentage (also known as ticket percentage) reflects the number of individual bets placed on each side of a game. For example, if 100 people bet on a game and 82 of them back the Cowboys, the bet percentage for the Cowboys would be 82%. This metric is a snapshot of public sentiment - essentially showing what casual fans and recreational bettors are favoring. It's a key starting point for identifying potential mismatches in betting trends.
Now, let's layer in money percentage (or handle percentage), which measures the total amount of money wagered. This is where the influence of larger bets becomes clear. Professional bettors, often referred to as "sharps", can place bets of $5,000 or $10,000 that heavily impact the money percentage, even if they only account for a small number of total tickets. Sportsbooks pay close attention to this figure because sharp bettors tend to win about 55% of the time, compared to the public's 40% win rate.
The difference between these two percentages - bet percentage and money percentage - tells an important story. This gap often reveals where professional bettors are focusing their money, as opposed to where casual bettors are placing their bets.
| Metric | What It Shows | Key Influencers |
|---|---|---|
| Bet Percentage | Number of individual tickets | Casual and recreational bettors |
| Money Percentage | Total dollars wagered | Professional and sharp bettors |
Pay attention to games where the money percentage exceeds the bet percentage by 10-15% or more. This discrepancy signals where professionals are putting their money, often highlighting spots where the public might be off the mark. Understanding this dynamic can help bettors identify opportunities to take a contrarian approach.
2. Find Sharp Money by Looking for Discrepancies
One of the most effective ways to spot where professional bettors, or sharps, are putting their money is by comparing bet percentages to money percentages. The key is to identify games where these two numbers don’t align - particularly when a team has a smaller share of the bets but a noticeably larger share of the money.
This concept is often referred to as the "Low Bets, High Dollars" principle. For instance, if a team accounts for only 30% of the total tickets but makes up 60% of the total money wagered, it’s a strong indicator that sharp bettors are backing that side. The disparity arises because sharps tend to place larger wagers, which significantly influence the money percentage, even if casual bettors are placing more individual bets on the opposing side.
A useful guideline to apply is the 10% discrepancy rule. If a team has at least 10% more money than tickets - for example, 30% of the bets but 40% of the money - it suggests that higher-value bets are concentrated on that team. To identify these opportunities, start by looking for games where one side has 65% or more of the tickets. This usually reflects the public’s preference. Next, calculate the gap by subtracting the ticket percentage from the money percentage. If the difference is +10% or more, it’s worth investigating further as a possible sharp play.
"If a team has 10 percent or more money than tickets, it may suggest bigger wagers are concentrated there." - Josh Applebaum, Casino.org
"If you see that the public bet percentage is very different from the money percentage, that means that big (and often sharp) money is coming in that sways the handle away from mirroring the public bet percentage." - Ray Belkora, OddsJam
3. Bet Against Heavy Public Favorites
When a team attracts more than 70% of the bets, it often signals an opportunity to go against the grain. This tactic, known as betting against the public, works because casual bettors tend to lean toward popular teams, recent winners, or high-profile franchises like the Dallas Cowboys or New York Yankees - often without considering the actual matchup. Sportsbooks are well aware of this predictable bias and adjust their lines accordingly.
To counteract the influx of public bets, sportsbooks often inflate the spread or price for favorites. This creates potential value for underdogs. For example, over a four-season span, underdog teams covered the spread 63.8% of the time when they received less than 40% of public bets during the first three weeks of the NFL and NCAAF seasons. Economist Steven Levitt also found that home underdogs won 53% of the time in both NCAA and NFL football games.
"The public loves to bet favorites and 'overs.' It's human nature to root for winners and scoring. Sportsbooks understand this and shade their lines accordingly." – Sports Insights
To make the most of this strategy, focus on high-profile games where favorites are receiving 70% or more of the bets. Pay attention to reverse line movement, which can indicate sharp money going against the public. Home underdogs facing popular road teams are particularly strong contrarian bets. Since public money tends to pour in closer to game time, waiting until just before kickoff can often yield a more favorable line as spreads continue to inflate. By taking this approach, you align yourself with the sportsbooks and position yourself against the public, which historically tends to lose in the long run.
4. Monitor the Gap Between Bet Count and Money Flow
Now that we've covered bet and money percentages, it's time to dive into the gap (or delta) between them and how it can signal actionable insights. For example, if one side of a wager gets 30% of the bets but pulls in 55% of the money, it points to a smaller group of bettors placing significantly larger wagers - often a sign of sharp action.
To calculate the delta, subtract the bet percentage from the money percentage. If the gap is 10% or more, it’s worth a closer look. This threshold can help uncover where professional bettors are putting their money, even when public betting trends seem to favor the other side.
The most promising opportunities often appear when a team or side draws 35% or fewer tickets but shows a delta of at least 10%. This pattern suggests the public is steering clear, but sharp bettors are heavily backing it. Keep in mind, though, that delta is just one piece of the puzzle. Use it as a starting point, then dig deeper into other factors like injuries, matchups, and line movement before making any decisions.
5. Verify Total Bet Volume Before Acting
When examining discrepancies in betting data, it's crucial to check the total bet volume to ensure the data's reliability. Percentages alone can be misleading, especially when the betting volume is low. For instance, a game might show that 70% of the money is on one side, but if there are only a handful of bets, that percentage becomes far less meaningful.
Low-volume games, like mid-week matchups with fewer than 40 bets, are particularly prone to skewed data. A single large wager can significantly distort the percentages. As Matt McEwan from SportsBettingDime explains: "If a game only has $1,000 wagered on it, you can throw out the idea of sharp action". On the flip side, high-profile events - such as NFL primetime games or playoff matchups - tend to attract much higher betting volumes. This larger sample size reduces the influence of individual bets and provides a clearer view of public sentiment.
It’s also important to check the ticket count. If the sample size is small, the data is less reliable and should be approached with caution.
| Event Type | Typical Volume | Reliability | Risk of Misleading Percentages |
|---|---|---|---|
| High-Profile (e.g., NFL/NBA primetime) | High (600+ picks) | High | Low; reflects broad market sentiment |
| Low-Profile (e.g., mid-week college games) | Low (<40 picks) | Low | High; easily skewed by a few bets |
Reviewing bet volume strengthens your confidence in the discrepancies you’ve identified. Keep in mind that bet volumes often increase significantly in the hours leading up to kickoff. For the most accurate insights, analyze the data closer to game time.
6. Compare Public Money Data with Line Movement
Once you’ve confirmed the bet volume, the next step is to analyze the direction of the line movement. A phenomenon known as reverse line movement (RLM) happens when most bets are on one side, but the bookmaker adjusts the line in favor of the other side instead. This is often a telltale sign that sharp bettors are placing significant wagers against the public. This mismatch between public betting patterns and line movement is a key indicator worth digging into.
Take this example: The Green Bay Packers open as -4.5 favorites, and over 75% of public bets are placed on them. Normally, the line would move further in their favor, say to -5 or -5.5. But if the line instead shifts from -4.5 to -3, it suggests sharp money is backing the opposing side.
"Reverse line movement is when the betting line moves in the opposite direction of the betting percentages" - Action Network
Interestingly, there are times when heavy public money doesn't budge the line at all. For instance, if 80% of bets are on a favorite but the spread remains steady, this could mean sharp bettors are placing larger wagers on the other side, balancing the sportsbook’s exposure. In some cases, sportsbooks may even feel confident enough to hold their position and essentially bet against the public.
To dig deeper, compare the percentage of tickets to the percentage of money. For example, if a team accounts for 42% of the bets but 51% of the money, this suggests larger wagers - likely from sharp bettors - are coming in on that side. Keep in mind that sharp bettors often place their bets early in the week, while the public tends to pile in closer to game time. If you notice a line shift early in the week that contradicts heavy public action, it’s a strong signal to investigate further.
Finally, don’t forget to check for external factors that might influence the odds. Late-breaking news, such as player injuries or weather conditions, can also explain line movement. However, if the line moves against public betting trends and no obvious external factors are at play, you’ve likely found where the professionals are putting their money.
7. Target High-Profile Games for Better Data
Big matchups like primetime NFL games, playoff showdowns, or major tournaments tend to offer more dependable public money data compared to less-followed weekday contests. Why? These high-profile games attract a massive volume of bets, providing a clearer picture of public sentiment. With so many wagers in play, the influence of a few large bets diminishes, making the data more reflective of the broader market. This creates a solid foundation for spotting where sharp money diverges from public opinion.
When a game garners significant attention, sportsbooks often increase betting limits, allowing for larger wagers. This combination of high betting limits and substantial volume sharpens the contrast between public bets - typically smaller in size and higher in number - and the larger, more calculated bets placed by sharps. For instance, during the January 4, 2025, NFL game between the Cleveland Browns and Baltimore Ravens, only 7% of public tickets backed the underdog Browns on the moneyline, yet 49% of the total money supported them. This stark difference highlighted sharp action on the Browns in a high-profile matchup.
"The public loves to bet on a favorite... Sportsbooks will often shade favorites bets, or set higher spreads that overestimate the favorite's true margin." - Daniel Craymer, Sports Editor, BettingTools
Teams with widespread popularity, like the Dallas Cowboys, New York Yankees, and Los Angeles Lakers, often attract a disproportionate amount of betting action. Casual bettors frequently let team loyalty or media hype guide their wagers, leading to inflated lines on these teams. Sharps, on the other hand, look to capitalize on this bias by targeting those inflated lines for added value. Additionally, high-profile games come with an abundance of expert analysis, injury updates, and historical data, making it easier to understand why public and sharp money might lean in certain directions.
When evaluating public money data, focus on these high-profile matchups with significant betting volume. The patterns you find in these games are not only easier to interpret but also more actionable.
8. Use WagerProof for Real-Time Public Bets and Money Lean
Understanding the dynamics of public versus sharp money is crucial, and WagerProof brings these insights together in one place. Tracking public betting percentages and money flow across various platforms can be overwhelming, but WagerProof simplifies the process by displaying live ticket and money percentages in real time. This makes it easy to spot sharp action - like when the percentage of money wagered on a team far exceeds the percentage of bets placed - without jumping between multiple sources.
The Edge Finder tool takes this a step further by combining public money data with market insights and historical trends. Instead of manually comparing bet counts and money flow, Edge Finder does the heavy lifting for you. It highlights opportunities where sharp money diverges from public sentiment, such as discrepancies in spreads or totals, so you can act quickly before sportsbooks adjust their lines.
WagerBot Chat transforms how you interact with live data. You can ask detailed, conversational questions like, "How does this team perform after trailing at halftime?" or "What’s the money percentage on the under for tonight’s Lakers game?" The AI pulls from professional-grade, real-time data to provide precise answers, helping you react to sudden changes - whether it’s breaking injury news or unexpected weather conditions that create short-term betting opportunities.
Additionally, real-time alerts and the AI Game Simulator keep you informed of critical developments. Whether it’s a late player scratch, a weather shift, or a sudden line movement, these tools ensure you can reassess probabilities instantly. The simulator runs thousands of matchup simulations, comparing predicted outcomes against current odds to quickly pinpoint mispriced lines.
9. Check Public Money Across Spreads, Totals, and Moneylines
Betting patterns can shift significantly depending on the market - spreads, totals, or moneylines - and these shifts often uncover hidden opportunities. Each type of bet tends to attract a different kind of bettor. For instance, while the spread might appear balanced, the moneyline or totals markets can reveal where professional bettors, or "sharps", are focusing their wagers.
Take a January 2025 NFL game between the Cleveland Browns and Baltimore Ravens as an example. In this matchup, the spread seemed balanced, with 31% of bets and 26% of the money on one side. However, the totals market told a different story, with 84% of bets and 88% of the money backing the "Over". This kind of data suggests that sharps might be leaning toward the underdog. Patterns like these can provide valuable insights when analyzing real game data.
Here's how you can use this information: If you see a team heavily discounted on the spread but drawing significant moneyline wagers, it could mean sharps believe the underdog might win outright. Similarly, when the public heavily favors the "Over", but sharp money flows to the "Under", it might indicate the game will end with fewer points than expected. This approach of analyzing multiple markets helps you focus on where the smart money is going, rather than just following popular opinion.
Pay close attention to gaps of 10% or more between the percentage of bets (tickets) and the percentage of money (handle) across these markets. For example, if an underdog moneyline attracts only 30% of bets but accounts for 60% of the handle, it's a strong signal that professional bettors are involved. By comparing these discrepancies across all markets, you can uncover real opportunities for value.
10. Combine Public Money with Other Data on WagerProof
To get sharper insights, blend public money data with tools like AI simulations, predictive models, and historical stats. WagerProof brings all of this together in one easy-to-use interface, helping you quickly spot value bets that sportsbooks might have missed. By combining raw public data with advanced analytics, you can gain a clearer picture of where opportunities lie.
For example, when you notice a mismatch between bet percentages and money percentages, WagerProof's Edge Finder can help you dig deeper. If the platform's predictive models and AI Game Simulator suggest that an underdog has a better chance of winning - based on thousands of simulations - you might have just found a strong opportunity. One analyst shared that by using this layered approach, they achieved a 65% success rate, far better than relying on instinct alone.
To understand why trends might be shifting, WagerBot Chat is a handy tool. It helps you quickly determine if public movements are based on overreactions or other situational factors. According to WagerProof, using AI-powered predictions like these can improve bet success rates by 15–20% compared to older, more traditional methods.
"The goal in sports betting isn't about winning every single wager - it's about consistently identifying edges and managing your bankroll wisely over time." - WagerProof
Another way to refine your strategy is by factoring in recent performance data. For instance, a quarterback's stats from the last four games might reveal more than season-long averages, especially if the public hasn’t caught on to recent trends. By calculating the implied probability from sportsbook odds (e.g., +150 translates to about a 40% chance) and comparing it to WagerProof's AI predictions, you can uncover mispriced lines. This multi-layered approach transforms public money data into a powerful tool for building a smarter betting strategy.
Conclusion
Public betting data sheds light on where casual bettors and professionals (sharps) are placing their money. When there's a noticeable gap between the number of tickets and the amount of money wagered, it often signals sharp, contrarian action. These gaps highlight market inefficiencies that sportsbooks exploit by adjusting lines to capitalize on public tendencies, like favoring favorites and overs.
Sustained success in betting comes from spotting these edges and aligning with sharp strategies. While public bettors tend to win about 50% of the time against the spread, professional sharps achieve closer to a 57% win rate. That seemingly small difference adds up significantly over time when decisions are based on data instead of emotions or media narratives.
"If you don't know where a line opened, how it moved, why it moved and what the public and the sharps are betting, you might as well be flipping a coin."
– Action Network Staff
This quote underscores how crucial it is to understand market dynamics. With this in mind, WagerProof equips you with the tools to make informed bets. From real-time public betting data and sharp action alerts to reverse line movement indicators and AI-driven value predictions, WagerProof helps you uncover opportunities others might miss. Features like the Edge Finder and WagerBot Chat enable you to quickly determine whether public movements are driven by overreactions or legitimate trends, giving you the confidence to make smarter, more calculated decisions.
FAQs
How can I spot sharp money in betting data?
To spot sharp money in betting data, pay attention to reverse line movement. This happens when betting lines move in the opposite direction of where most public bets are placed. Such shifts often indicate that professional bettors, known as sharps, have made substantial wagers, swaying the market.
Another clue is sudden, noticeable line changes that occur without a surge in public betting activity. These adjustments are typically the result of sharp action rather than casual bettors. Monitoring these trends can give you valuable insights for making smarter betting choices.
What is reverse line movement and why does it matter in betting?
Reverse line movement occurs when the betting line moves in a direction that goes against where the majority of public bets are landing. In simpler terms, it means the line shifts toward the less popular side, even though most of the public money is on the other.
Why does this matter? It often signals that sharp bettors - the pros with deeper insights or advanced analytics - are backing the less favored side. These bettors typically have access to higher-quality information, making their actions a potential goldmine for spotting opportunities. Recognizing reverse line movement can help you align with smarter betting trends instead of simply following the crowd.
Why is it beneficial to focus on high-profile games when analyzing betting data?
High-profile games naturally draw the most attention, both from fans and bettors, making them a prime source for gaining useful insights. The sheer number of bets placed on these matchups allows you to get a clearer sense of public sentiment, monitor shifts in betting lines, and uncover opportunities to apply strategies like fading the public or following sharp action.
Another advantage of these games is the abundance of transparent data. The high volume of activity means more information is available, which can help you make better-informed decisions. By zeroing in on these marquee matchups, you’re tapping into a wealth of data that can highlight trends and discrepancies, giving you a chance to fine-tune your betting approach.
Related Blog Posts
Ready to bet smarter?
WagerProof uses real data and advanced analytics to help you make informed betting decisions. Get access to professional-grade predictions for NFL, College Football, and more.
Get Started Free