Ultimate Guide to Anomaly Detection in Sports Analytics
Anomaly detection in sports analytics is about identifying unusual patterns or performances in data. This helps coaches, bettors, and analysts make better decisions, whether it’s spotting a player’s sudden fatigue, predicting regression in performance, or detecting fraud in betting markets.
Here’s what you’ll learn:
- What anomaly detection is: Identifying outliers in player or team performance.
- Why it matters: It can prevent injuries, predict outcomes, and even expose match-fixing.
- Key methods: Z-scores, regression analysis, clustering, and machine learning models like neural networks and LSTM.
- Applications: Real-time alerts for fatigue, fraud detection, and betting insights.
- Tools: Platforms like WagerProof and libraries like PyOD and Scikit-learn.
Anomaly detection combines statistical and machine learning techniques to analyze sports data faster and more accurately. Whether you’re a coach, analyst, or bettor, it’s a powerful way to stay ahead in the game.
Statistical Methods for Detecting Anomalies
Z-Score Analysis
Z-scores measure how far a data point deviates from the average, expressed in standard deviations. In sports analytics, performances that exceed 2 standard deviations from the mean are often flagged as anomalies. For instance, imagine a basketball team with an average three-point shooting percentage of 34% suddenly hitting 41% over a 10-game stretch. That spike would be identified as an anomaly.
Take the 2022 NBA season as an example. One team experienced this exact situation. A deeper analysis revealed they weren't getting better looks but were simply making tougher shots. As their shooting percentage regressed to the mean, the team failed to cover the spread in 6 of their next 8 games. Bettors who spotted this Z-score anomaly early could fade the team before the betting markets adjusted.
"Outlier detection in sports stats can reveal hidden betting value that most people overlook." – Underdog Chance
Regression analysis takes this a step further by comparing expected and actual outcomes for a more nuanced understanding.
Regression Analysis
Regression models are used to compare expected outcomes with actual results, helping to uncover discrepancies. In baseball, for example, xERA (expected ERA) highlights when a pitcher's performance is bolstered by factors like defense or luck. If a pitcher has a 2.80 ERA but a 5.10 xERA, it suggests their success might not be sustainable.
One real-world case involved a pitcher with those exact stats - 2.80 ERA, 5.10 xERA, and a batting average on balls in play (BABIP) of .225. Savvy bettors flagged this pitcher as a regression candidate and faded him as a favorite just before his performance declined midseason. The same logic applies to NFL teams benefiting from extreme turnover margins. For example, a team with a +10 turnover margin over four games lost 5 of their next 7 games as their metrics normalized.
Box plot analysis, meanwhile, offers a quick visual method for spotting such anomalies.
Box Plot Analysis
Box plots provide a visual summary of data distribution, highlighting anomalies that fall outside the normal range. While primarily a visualization tool, the statistical principles behind box plots are useful for identifying noise in metrics like yards per play or player usage rates. For example, in soccer, if a team wins 3–0 but has an Expected Goals (xG) of only 0.8, a box plot would clearly display this as an anomaly, suggesting the result may not be sustainable.
Data Science & Anomaly Detection for Sports Injury | Kristin Morgan
Machine Learning Techniques for Anomaly Detection
Machine Learning Model Accuracy Comparison for Sports Betting Fraud Detection
Clustering Algorithms
Clustering algorithms are a go-to method for grouping similar data points, making it easier to identify outliers that deviate from established patterns. For instance, K-Means divides data into a set number of clusters based on centroids (cluster centers), while DBSCAN identifies dense regions and flags points that fall outside these clusters as anomalies.
In April 2024, data scientist Pol Marin applied K-Means clustering to analyze a dataset of 2,306 soccer players, aiming to identify recruitment targets for Fulham FC. By setting the model to create 15 clusters, he pinpointed players with standout performance traits. This analysis highlighted Anton Stach (valued at $15M) and Serhou Guirassy (valued at $40M) as ideal candidates to address team weaknesses, all within a $60M budget. Another clustering method, K-Nearest Neighbor (KNN), flags anomalies by calculating distances between data points - if a point lies too far from the normal clusters, it's marked as abnormal.
However, clustering isn't perfect. It can struggle with anomalies that depend on context, such as a sudden spike in performance that might reflect a genuine peak rather than an error. Tools like the Elbow Method can help refine clustering models by determining the optimal number of clusters. This is done by plotting the sum of squared errors and identifying where the curve flattens. Beyond clustering, neural networks offer a more dynamic approach to anomaly detection by learning patterns directly from raw data.
Neural Networks and Autoencoders
Neural networks take anomaly detection to the next level by automating the process of learning patterns, eliminating the need for manual feature selection. Autoencoders, a type of neural network, are particularly effective. They compress data into a simplified "latent space" and then reconstruct it. If the reconstruction error is unusually high, the data point is flagged as an anomaly.
"If a model trained on cat images fails to accurately reconstruct a new image, that image is flagged as an anomaly."
– Piero Paialunga, Machine Learning Engineer
This technique is especially useful for handling high-dimensional data, such as player metrics, weather conditions, and live betting odds, without requiring labeled examples. Unlike traditional methods, which can falter with complex, non-linear datasets, autoencoders excel at identifying anomalies even when they closely resemble normal data in terms of frequency or amplitude.
Time-Series Models
For sequential data, LSTM networks (Long Short-Term Memory) are highly effective at detecting anomalies by capturing long-term dependencies that snapshot methods might miss. These models are particularly suited for tracking how patterns evolve over time, making them ideal for analyzing shifts in betting odds or performance trends during a game.
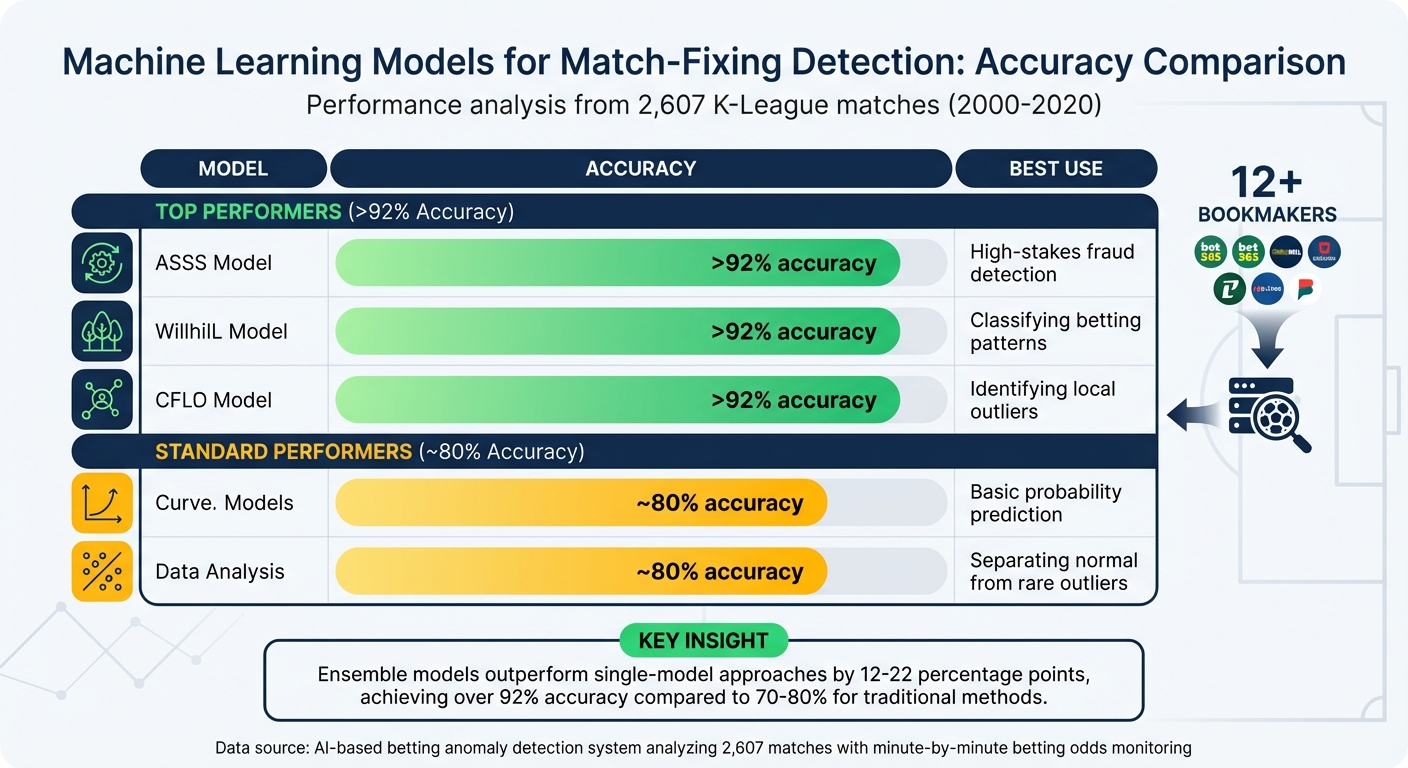
In March 2024, researchers used an AI-based system to uncover match-fixing in the South Korean K-League by analyzing betting odds data from 12 companies (including Bet365 and Willhill) spanning 2000 to 2020. The system reviewed 2,607 matches, monitoring win-tie-loss patterns at minute-by-minute intervals. By combining multiple algorithms - such as Random Forest, KNN, and others - the ensemble model achieved an impressive detection accuracy of over 92%, significantly outperforming traditional single-model approaches, which hovered around 70–80%.
| Model Type | Accuracy (Match-Fixing) | Best Use Case |
|---|---|---|
| Ensemble Model | >92% | High-stakes fraud detection |
| Random Forest | >92% | Classifying betting patterns |
| KNN | >92% | Identifying local outliers |
| Logistic Regression | ~80% | Basic probability prediction |
| SVM | ~80% | Separating normal from rare outliers |
The success of these models hinges on proper data preprocessing. For example, match data must be standardized - either padded or truncated - so that all games have uniform data lengths before training. Without this step, models can encounter errors when comparing games with differing numbers of data points, such as 50 versus 80. These time-series models also integrate seamlessly with real-time systems, offering continuous monitoring and instant anomaly alerts during live events.
Applications in Sports Betting Analytics
Performance Drops and Fatigue Alerts
Understanding when athletes hit their physical limits can open up critical opportunities for bettors. Extreme Value Theory (EVT) comes into play here, analyzing peak efforts like sprint speeds to predict when fatigue might set in. These predictions are based on individualized historical data, allowing for tailored insights.
Take, for example, the RKS Raków Częstochowa Football Academy, which, between January and June 2023, used the APEX-PRO GPS system to gather 9,000 records per player every month. Researchers focused on metrics such as "Decelerations Total Distance in Zone 5 and 6", using linear models with a relative error of just 2.3%. The results showed that extreme efforts in high-intensity zones often led to temporary fatigue and performance declines.
"The use of Extreme Value Theory (EVT) to analyze these extreme moments... is a pioneering approach that can provide new tools for predicting key periods of the game in which a player, after making extreme efforts, potentially exposes himself to a temporary decrease in the quality of his game." – Scientific Reports
Machine learning systems take this a step further by recalculating win probabilities live as fatigue indicators emerge. Metrics like reduced High Metabolic Load Distance (HMLD), fewer accelerations, and less distance covered in high-speed zones become key signals. These real-time adjustments can improve a bettor's success rate from around 50% to 60% by identifying edges that others might miss. Beyond betting, these insights also help flag irregular patterns, adding another layer of utility.
Fraud Detection in Betting Patterns
AI isn't just about tracking athlete performance; it also plays a crucial role in safeguarding betting markets from fraud. By analyzing odds across multiple bookmakers, AI systems can spot unusual patterns in line movements that deviate from expected market behavior.
A great example of this comes from a June 2023 study by researchers Jizhi Liu, Dulani Jayasuriya, and Ryan Elmore. They examined the 2022 NBA playoffs and identified the Phoenix Suns vs. Dallas Mavericks series as having the lowest natural occurrence probability - an anomaly that warranted further scrutiny.
Ensemble models have proven especially effective in fraud detection, achieving over 92% accuracy and outperforming single-model approaches. These systems classify matches into three categories: "Normal" (safe), "Caution" (potential risk), and "Abnormal" (high likelihood of fraud). This allows regulatory bodies to intervene in real time when necessary.
"Anomalies serve as red flags that raise suspicions of potential match-fixing, and detecting them is essential. By analyzing these anomalies, we can uncover instances of manipulation and take appropriate action to maintain the fairness of sports competitions." – Nature, AI-based betting anomaly detection system
Real-Time Prediction Validation with WagerProof

WagerProof takes fraud detection a step further by validating predictions in live betting scenarios. Its Trap Detector identifies discrepancies between soft and sharp sportsbooks. When soft books display inflated totals or spreads that differ from sharp consensus, the system flags these as potential fade signals or value opportunities.
This system updates odds every 60 seconds across more than 80 sportsbooks, ensuring up-to-the-minute accuracy. Another feature, Steam Move Tracking, monitors synchronized line movements across multiple sharp books. These rapid shifts often signal significant professional money entering the market, giving bettors timely alerts before the broader market adjusts.
Challenges and Best Practices
Managing False Positives
Handling false positives is a major hurdle in anomaly detection. When systems incorrectly flag normal events as suspicious, it leads to alert fatigue and wastes analysts' time. A South Korean K-League study (2000–2020) demonstrated a solution by using an ensemble voting mechanism across 12 global bookmakers. This approach achieved over 92% accuracy, compared to the 70–80% accuracy of single-model systems.
A three-tier classification system - categorizing events as "Normal", "Caution", or "Abnormal" based on the consensus of three or more models - proved effective in reducing false positives. Another key strategy was refining the dataset by excluding static data with minimal movement or low betting volumes. For instance, the K-League study narrowed its focus to 2,607 relevant data points by filtering out matches that could introduce irrelevant patterns. Additionally, applying regularization (C = 0.1) helped the models avoid overfitting, ensuring they performed well on unseen data.
Unsupervised Detection in Unlabeled Data
False positives aren't the only challenge - unsupervised methods are crucial when working with unlabeled datasets. Sports datasets often lack objective labels, as tactical plans are usually undisclosed, and rare events like match-fixing are hard to confirm. In fact, only 21 abnormal cases were identified out of 2,607 matches in the K-League study. To address this, analysts rely on algorithms like DBSCAN, Isolation Forest, and Local Outlier Factor (LOF) to detect patterns without pre-labeled examples.
Sports data is dynamic - tactics and player skills evolve quickly, making older data (beyond one or two seasons) less relevant. Additionally, data collected from play-by-play accounts can include human errors, while physical data often relies on subjective questionnaires. Assigning responsibility for anomalies (e.g., a failed pass) also complicates analysis, as it’s unclear whether the issue lies with the player or a teammate’s positioning.
Proxy indicators, such as Expected Goals (xG), are often developed to measure performance quality indirectly when labels are unavailable. Standardizing time-series data through padding or truncating ensures consistency for model training. Importantly, domain expertise is critical to ensure these indicators are both meaningful and reliable, helping to minimize false positives. Together, these methods integrate effectively with real-time analytics, creating a well-rounded approach.
Tools and Platforms for Implementation
Implementing these methods requires reliable tools and platforms. Python libraries are the backbone of most anomaly detection workflows. For instance, PyOD offers over 40 outlier detection algorithms, including Isolation Forest and AutoEncoders, making it suitable for large-scale applications. Scikit-learn provides widely-used methods like One-Class SVM and Isolation Forest, which integrate seamlessly into machine learning pipelines. For time-series-specific anomalies, Prophet is excellent for modeling trends and seasonality, while ELKI (a Java-based library) supports advanced clustering and research-focused tasks.
For real-time sports betting analytics, platforms like WagerProof stand out. WagerProof updates odds every 60 seconds across 80+ sportsbooks, automatically identifying outliers and value bets. Its Trap Detector flags discrepancies, such as inflated totals or spreads that deviate from sharp consensus, while Steam Move Tracking monitors synchronized line shifts, alerting users to significant professional money movements before broader market adjustments occur.
| Tool/Library | Primary Use Case | Key Algorithms |
|---|---|---|
| PyOD | Outlier detection | Isolation Forest, LOF, AutoEncoders |
| Scikit-learn | General ML integration | One-Class SVM, Isolation Forest |
| ELKI | Advanced clustering | DBSCAN, LOCI, LOF |
| Prophet | Time-series forecasting | Seasonal/Trend-based detection |
| WagerProof | Real-time betting analytics | Real-time prediction validation |
Conclusion
Anomaly detection has become a game-changer for anyone deeply involved in sports analytics and betting. The shift from basic statistical tools like Z-scores to advanced machine learning techniques highlights just how far the field has come. These methods uncover crucial insights - ranging from identifying injury risks and strategic adjustments to spotting potential fraud.
The advantages are clear: better data accuracy, quicker decision-making, and a real edge over the competition. Whether you're monitoring player fatigue in real time, fine-tuning predictive models, or scanning betting markets for unusual activity, anomaly detection is at the heart of smarter, data-driven strategies.
Real-time platforms have taken this to the next level, offering actionable analytics at unprecedented speeds. For instance, platforms like WagerProof integrate advanced detection techniques directly into their systems. They automatically flag outliers and value bets, helping users spot trap lines, steam moves, and market discrepancies before they gain widespread attention.
The takeaway? Start with robust data preprocessing, use a mix of detection methods for improved accuracy, and always validate anomalies with expert knowledge. As sports data grows more complex, the ability to quickly identify and understand abnormalities will set top analysts apart.
Whether you're a coach, a data analyst, or a bettor, incorporating these statistical and machine learning methods into your workflow isn’t optional - it’s essential. It’s the difference between reacting to trends after the fact and capitalizing on opportunities before they’re gone.
FAQs
How does anomaly detection help prevent sports injuries?
Anomaly detection plays a key role in preventing sports injuries by spotting unusual patterns or deviations in an athlete's data that might indicate a higher risk of getting hurt. By examining factors like biometric stats, training intensity, and performance trends, these algorithms can catch warning signs early, giving coaches and medical teams time to act.
Take this as an example: if an athlete's workload jumps significantly or their recovery stats fall outside typical levels, anomaly detection can notify staff to tweak training plans or introduce recovery measures. This kind of proactive approach helps lower the chances of overuse or sudden injuries, promoting better long-term health and performance for athletes.
What challenges arise when using machine learning for anomaly detection in sports analytics?
Using machine learning for anomaly detection in sports analytics isn't without its hurdles. Sports data is incredibly complex and constantly changing, which makes defining what counts as "normal" a tough task. Sports outcomes are unpredictable by nature, influenced by countless factors, so distinguishing genuine anomalies from regular fluctuations can be tricky for models.
Another major challenge lies in data quality. Sports datasets often include inconsistencies, missing entries, or irrelevant details, all of which can skew results. On top of that, some applications - like spotting betting irregularities or potential match-fixing - demand real-time analysis of massive datasets. This requires algorithms that are both fast and accurate, which isn't always easy to achieve.
And then there’s the issue of adaptability. Sports strategies, player performance, and betting markets are always evolving. To keep up, models need to be frequently updated and maintained, which adds another layer of complexity. Building and managing flexible data pipelines that can adjust to these changes is no small feat.
How does WagerProof use anomaly detection to improve sports betting insights?
WagerProof leverages anomaly detection to pinpoint outliers and irregular patterns in sports data, giving bettors a chance to spot hidden opportunities. By diving into both real-time and historical data - like prediction market spreads, betting volumes, and statistical models - it uncovers discrepancies that might indicate market inefficiencies or potential value bets.
For example, if betting trends or a team's performance suddenly veer off from what’s expected, WagerProof sends out alerts to flag potential risks or opportunities. It also keeps an eye out for unusual activity, such as sharp spikes in betting volume or odds that don’t align. This way, bettors gain the insights they need to make more informed decisions, all while maintaining a clearer view of the market.
Related Blog Posts
Ready to bet smarter?
WagerProof uses real data and advanced analytics to help you make informed betting decisions. Get access to professional-grade predictions for NFL, College Football, and more.
Get Started Free