How to Use Live Data for In-Game Betting
Live data is the key to smarter in-game betting. It updates in real-time, helping you make decisions faster than sportsbooks adjust their odds. By combining real-time stats, public betting trends, and prediction market mismatches, you can spot opportunities others miss. Here's what you need to know:
- Public Betting Splits: Track where casual bettors and sharp money are going. Look for gaps between ticket percentages (number of bets) and money percentages (amount wagered) to identify professional action.
- Prediction Market Mismatches: Compare sportsbook odds with prediction markets to find undervalued lines. Quick action is essential as sportsbooks catch up fast.
- Historical + Live Data: Use historical stats like shooting percentages or bullpen ERA alongside live triggers like injuries or momentum shifts to refine your bets.
- Timing Bets: Wait 30–60 seconds after major plays for the market to stabilize. Avoid betting during streaming delays (5–30 seconds).
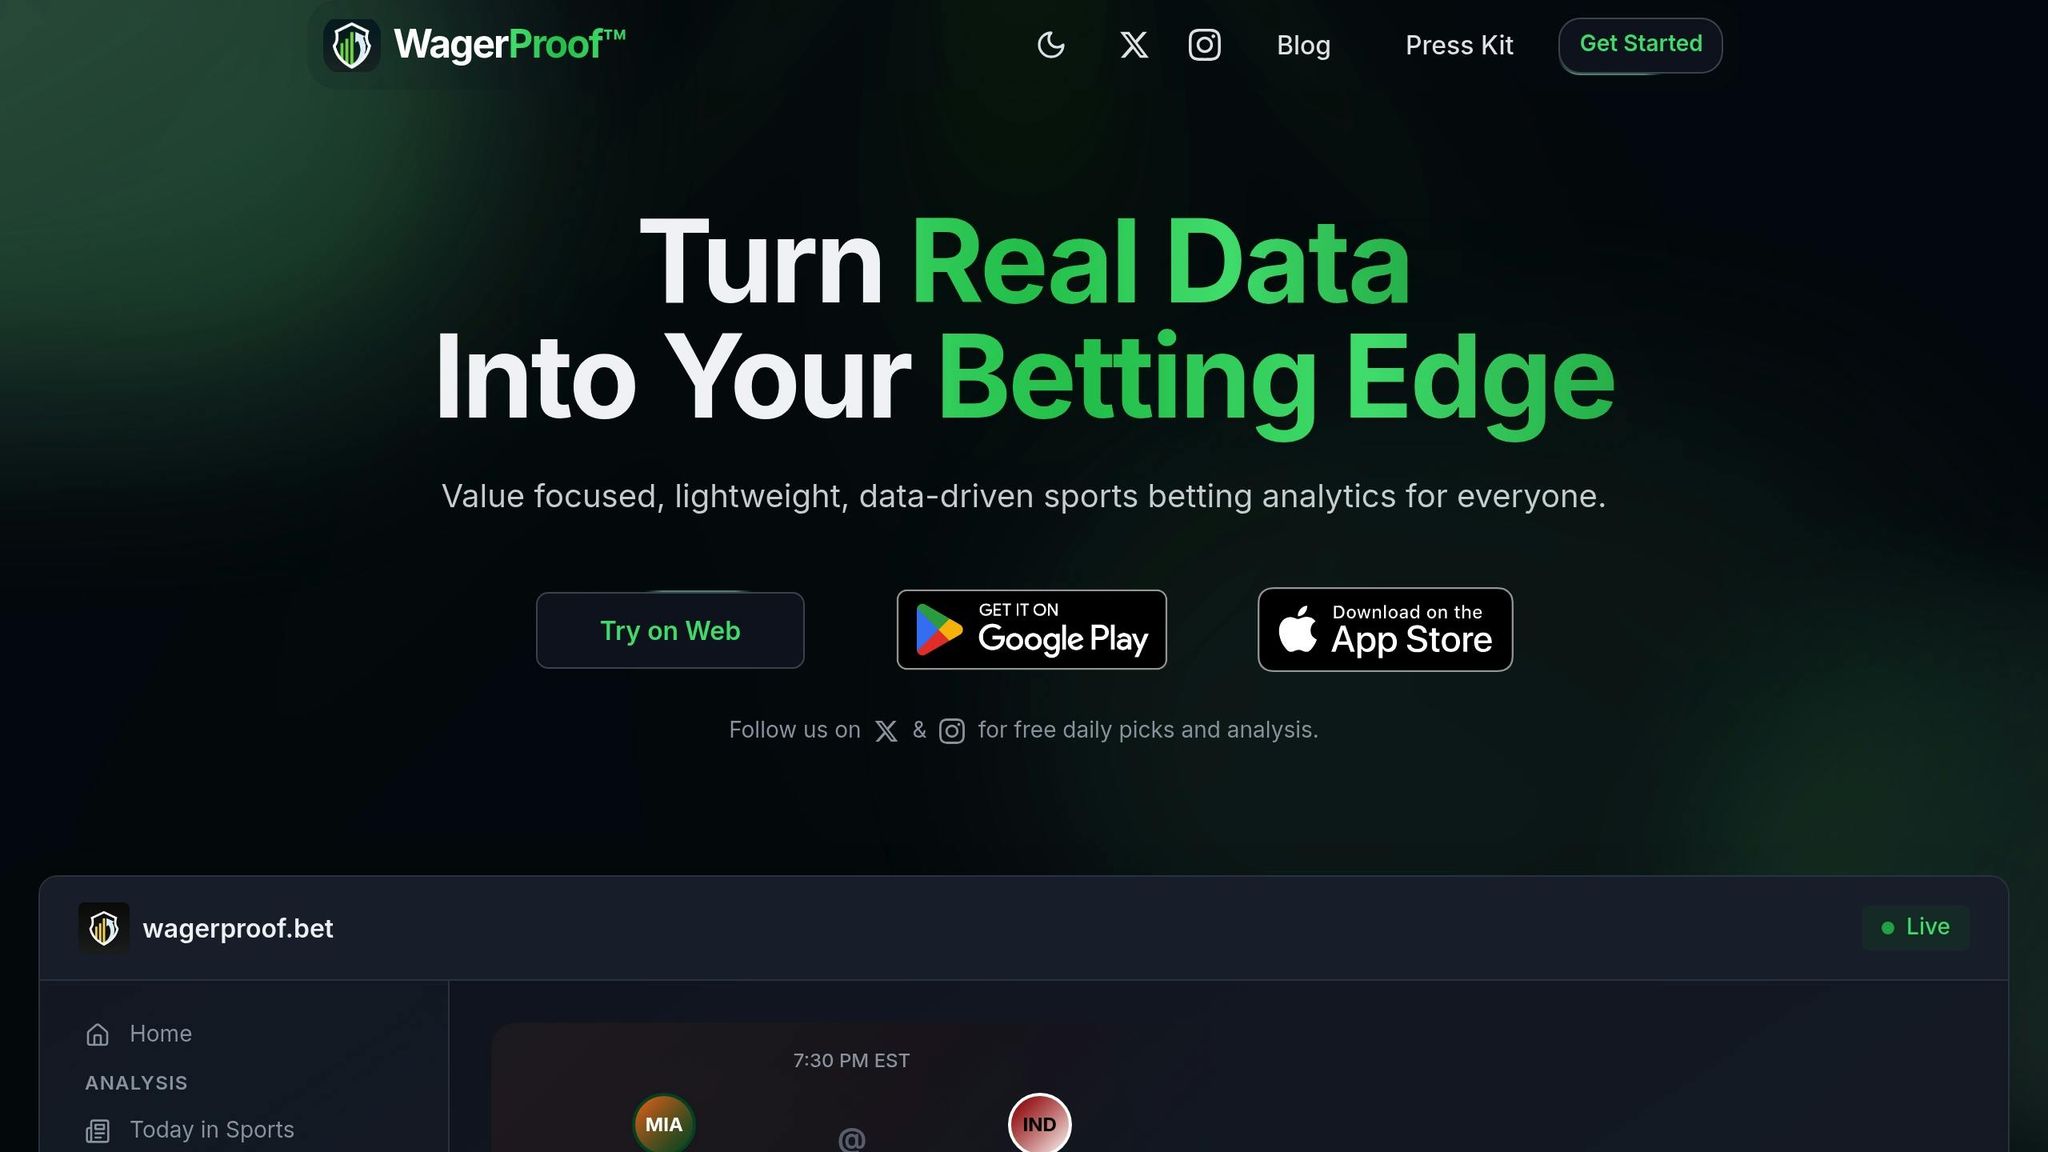
- AI & Community Tools: Platforms like WagerProof offer real-time alerts, AI simulations, and peer insights to validate your strategy.
The goal? Stay ahead of odds changes and avoid public overreactions. Live betting makes up 70–80% of U.S. wagers, so mastering these tools and strategies is essential for success.
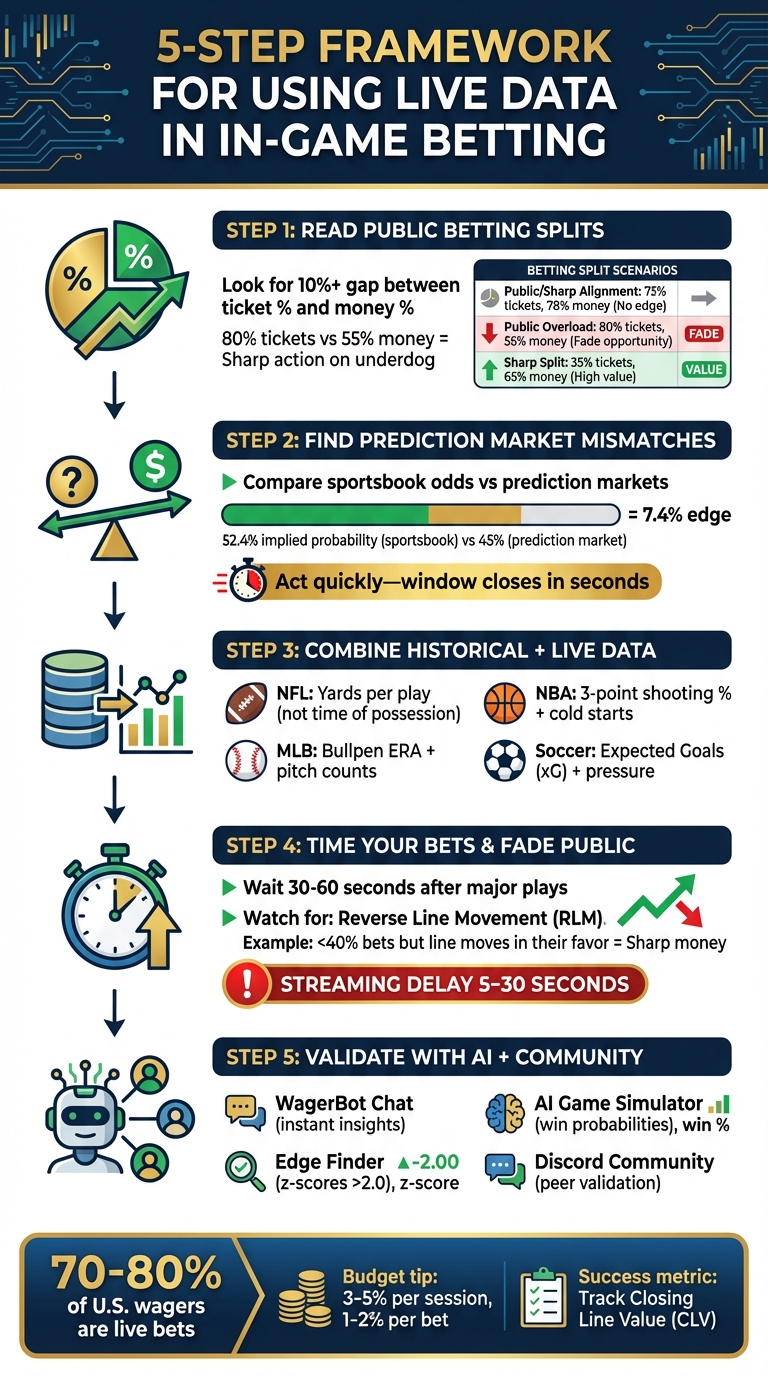
5-Step Framework for Using Live Data in In-Game Betting
The Ultimate Guide to Profitable Live Sports Betting: +EV Betting | Pinnacle Sportsbook Academy
Step 1: Read Public Betting Splits and Money Percentages
When it comes to live betting, public betting splits can be a game-changer. This data reveals how the public feels about a matchup and where the money is actually going. By comparing ticket percentages (number of bets) and money percentages (amount wagered), you can identify possible sharp money trends. Spotting gaps between these numbers gives you a potential edge, especially during in-game betting.
Bet Percentages vs. Money Percentages
Ticket percentages show how many bets are placed on a specific side. For example, if 75% of all bets are on one team to cover the spread, it reflects public opinion - essentially, what casual bettors expect. On the other hand, money percentages track the actual dollars wagered. If 75% of tickets are on a team, but only 55% of the money is, it suggests that larger bets (often from professional bettors) are going in another direction.
The key here isn’t just the raw percentages but the delta - the gap between ticket and money percentages. A difference of 20% or more often signals sharp money, especially when a favorite has overwhelming public support but less money backing them. For instance, if 80% of tickets are on a favorite, but only 55% of the money is, it might indicate that sharp bettors are putting their cash on the underdog. This is your sign to investigate further.
| Scenario | Ticket % | Money % | Interpretation |
|---|---|---|---|
| Public/Sharp Alignment | 75% | 78% | No edge; public and sharps agree |
| Public Overload | 80% | 55% | Potential fade; big money isn't following the hype |
| Sharp Split | 35% | 65% | High value; professionals are backing the less popular side |
Example: How to Spot Sharp Action
Take the NFL game on January 4, 2025, between the Cleveland Browns and Baltimore Ravens. Betting splits showed that only 7% of tickets were on the Browns, yet they accounted for 49% of the total money wagered. That massive 42% gap pointed to heavy professional backing for Cleveland, even as the public overwhelmingly favored Baltimore.
This kind of pattern during live betting is a strong indicator of sharp action. Professionals don’t bet randomly; they act on factors the general public often overlooks, like a sudden lineup change, a momentum shift, or an overreaction to a single play. These discrepancies are where opportunities lie, especially as game day approaches and professional money ramps up in high-liquidity markets.
"The delta matters: The raw percentages are less important than the difference between Ticket % (public sentiment) and Money % (sharp conviction)." - EdgeSlip
With this knowledge, you can start identifying mismatches in the market and use them to refine your live betting strategy.
Step 2: Find Prediction Market Mismatches
The next step is identifying mismatches between prediction markets and sportsbooks. These mismatches happen when data sources disagree on the true probability of a game’s outcome. Sportsbooks rely on a mix of algorithms and traders to manage risk, while prediction markets adjust almost instantly based on collective sentiment and new information.
These gaps can present valuable opportunities. Prediction markets often react immediately to events, such as a scoring play or breaking news, while sportsbooks may take longer - sometimes seconds or minutes - to update their odds due to feed delays. For example, in June 2025, a tweet from Elon Musk about Tesla's Robotaxi service caused the implied probability on Polymarket to skyrocket from 10% to 70% within hours. Trader Max de Groot saw this as an emotional overreaction rather than a reflection of regulatory realities. By betting against the surge, he profited when the launch was eventually delayed. Spotting these lags can give you a critical edge, especially with tools that automate the process and highlight these discrepancies in real time.
How WagerProof's Outlier Detection Works
WagerProof simplifies this process by automatically comparing prediction market prices to sportsbook odds in real time. If, for instance, a prediction market shows a 45% probability for an outcome, but a sportsbook’s odds imply a 52.4% probability, the system flags this as an outlier. These alerts help you identify two key situations:
- Steam moves: Sudden and sharp line shifts across multiple sportsbooks, often triggered by heavy betting from sharp bettors.
- Stale lines: Odds that remain unchanged at one sportsbook while others have already adjusted.
The platform also tracks low-liquidity leagues, like Sweden’s Allsvenskan, where markets can be moved significantly - by as much as 10–15% - due to limited data and sharp money influence. This automated detection complements your review of public betting splits and historical trends, saving you the hassle of manually calculating implied probabilities or monitoring multiple sportsbooks. Instead, WagerProof delivers clear, actionable alerts directly to you.
How to Act on Mismatch Alerts
When you receive an alert, the next step is to convert the odds into implied probabilities and evaluate the gap. For example, -110 odds translate to an implied probability of about 52.4%. If a prediction market suggests a 45% probability, the 7.4% difference may indicate a profitable opportunity.
Act quickly, especially with sportsbooks that lag in updating their lines. The window to place your bet before the odds adjust can be incredibly short. Timing is everything - capitalize before the slower book catches up and the advantage disappears.
Step 3: Combine Historical Stats with Live Data
Historical stats provide the foundation, while live data captures real-time changes. By merging the two, you can uncover betting opportunities others might miss. Take an NBA team known for stellar three-point shooting. If they open a game 0-for-8 from beyond the arc, live totals will adjust significantly lower. This is where regression to the mean comes into play - the team is likely to return to its historical shooting average, creating a potential edge. This blend of data lays the groundwork for applying sport-specific situational triggers.
For instance, in the NFL, don't get distracted by time of possession stats. Instead, focus on yards per play. If a team is leading on the scoreboard but averaging just 3.2 yards per play compared to their opponent's 6.8, it signals an unsustainable advantage. In MLB, keeping an eye on pitch counts and bullpen ERA is crucial. A starter losing velocity or hitting a high pitch count might indicate it's time to consider an "Over" bet, especially if historical bullpen data supports it.
Apply Historical Performance Data
While earlier steps help identify market inefficiencies, combining historical stats with live data adds a layer of context rooted in proven performance. This is where a pre-game playbook becomes invaluable. For example, if a favorite is down by 10 points at halftime but has a strong historical offensive efficiency, betting on their second-half moneyline could be a smart move. Halftime markets often overemphasize first-half performance while undervaluing historical trends like coaching adjustments and regression patterns.
Player-specific live data is just as important. In basketball, monitor foul trouble for key players. In baseball, track bullpen usage trends. When you pair these live observations with historical metrics, you get sharper insights:
| Sport | Key Historical Metric | Live Data Trigger |
|---|---|---|
| NFL | Red Zone Efficiency | Yards per play discrepancy |
| NBA | 3-Point Shooting % | Cold starts (e.g., 0-for-8) |
| MLB | Bullpen ERA / WHIP | Starter pitch count/fatigue |
| Soccer | Expected Goals (xG) | Sustained pressure/corners |
Use WagerBot Chat for Real-Time Insights
Integrating historical and live data is powerful, but adding real-time tools makes it even better. WagerBot Chat simplifies this process by providing instant answers during live games. Instead of sifting through stats to figure out how a team typically performs in the second half when trailing, you can ask the tool directly and get immediate, data-driven insights.
"Instead of manually digging through databases, you can get instant, data-backed answers about team performance in similar situations." - WagerProof
For example, if an NBA team starts 0-for-8 from three-point range, WagerBot Chat can quickly pull historical shooting data to help you assess whether a live "over" or comeback bet makes sense. The conversational interface simplifies complex data, making it easier to act on regression opportunities in real time.
Step 4: Use Data for Fade Strategies and Line Movements
Now it’s time to put live data to work and spot contrarian opportunities. By combining historical insights with real-time data, you can focus on fading public trends - betting against the crowd. This strategy taps into professional insights, as public bettors often lean toward favorites, home teams, and "overs." These tendencies can inflate lines, creating opportunities on the opposite side.
When to Fade the Public
One of the clearest signs to fade the public is reverse line movement (RLM). This happens when a team gets less than 40% of bets, but the line still moves in their favor. For instance, during NFL Week 12 in November 2024, the Green Bay Packers opened as -4.5 favorites against the Minnesota Vikings. Despite over 75% of public tickets backing the Packers, the line shifted to -3 by game time. This indicated sharp money was backing the Vikings, who ultimately covered the spread.
"The public loses. Not every time, but over the long haul, being on the same side as the majority of bettors isn't a sound strategy." - Action Network Staff
Tools like WagerProof can help you spot these discrepancies. For example, if most tickets are on one side but the total money wagered on that side is much lower, it’s often a sign that professional bettors are backing the opposite outcome. Sharps also tend to buy on bad news - betting on teams when a star player is unexpectedly ruled out. The public tends to overreact to such news, pushing the line further than the player’s absence justifies statistically.
Time Your Bets with Live Line Movements
Timing is everything when it comes to live betting. After major events, wait 30–60 seconds for the market to stabilize before placing your wager. Live betting markets typically have a higher vig (6–10%) compared to pregame markets (around 4.5%), so patience can save you money.
If you're betting on a favorite, placing your wager early can lock in better value before public money shifts the line. On the other hand, if you're backing an underdog, waiting until closer to game time - or even during the game - can result in a more favorable line as public money flows in. Keep an eye out for steam moves, which are sudden, sharp line shifts across multiple sportsbooks. These movements often indicate large bets from respected syndicates, and WagerProof's real-time alerts can help you act before the value disappears.
One thing to watch out for: TV and streaming delays. These can range from 5–30 seconds, giving sportsbooks a head start in adjusting lines. Understanding these dynamics can help you refine your timing and make smarter bets.
Step 5: Use Community and AI for Final Decisions
Once you've timed your bets using live data, the next step is to validate your decision by tapping into both community insights and AI tools. Combining these perspectives helps identify blind spots and boosts your confidence before placing a wager. AI can run thousands of simulations in seconds, while human editors and community members provide the context that raw data might miss - like noticing a player’s hesitation or a coach’s unexpected tactical change.
Join the WagerProof Discord Community
WagerProof’s Discord community is a hub for data-savvy bettors who exchange real-time insights during live games. If you notice something unusual, like reverse line movement or a split that seems off, you can quickly check with the community to see if others are spotting the same patterns. This kind of collective feedback helps you filter out random noise and focus on meaningful trends. By learning from others’ experiences, you can refine your strategy and make smarter decisions. This peer validation is a natural complement to the precision of AI tools.
Combine Expert Picks with AI Tools
WagerProof combines the expertise of Real Human Editors with advanced automated models to ensure that the guidance you receive remains reliable, even during unpredictable live events. Transparency is a cornerstone - WagerProof shows the data and calculations behind every recommendation.
Here’s how their AI tools can help:
- WagerBot Chat: Offers instant data insights for specific questions, such as how strong winds (15+ mph) might affect a team’s passing game.
- AI Game Simulator: Runs thousands of simulations to provide win probabilities, giving you a clearer picture of potential outcomes.
- Edge Finder: Pinpoints outliers and identifies mispriced lines using metrics like z-scores (look for scores above 2.0).
By combining these tools, you can validate your insights and ensure your bets are well-informed. For example, AI might highlight a potential value, but you can use the “eye test” and feedback from the community to confirm whether the opportunity is worth pursuing. This approach integrates all the previous steps into a streamlined, data-driven betting strategy.
| Tool | Function | Key Output |
|---|---|---|
| WagerProof Discord | Peer & Expert Discussion | Real-time strategy refinement and shared insights |
| WagerBot Chat | AI Conversational Data | Quick answers to game-specific questions |
| AI Game Simulator | Predictive Modeling | Win probabilities from thousands of simulations |
| Edge Finder | Market Analysis | Highlights outliers and consensus gaps in sportsbook lines |
Conclusion
Key Takeaways for In-Game Betting
In-game betting has become a dominant force, making up 70–80% of total U.S. wagers. To excel in this fast-paced environment, you need to process live data more effectively than others. This guide's five-step framework provides a roadmap for smarter betting. Start by monitoring public betting splits - look for a 10% or greater difference between ticket and money percentages to identify sharp action. Then, pinpoint prediction market mismatches to catch undervalued lines before sportsbooks adjust.
Historical performance metrics can validate live data signals. Tools like WagerBot Chat can help provide real-time context. For example, you can quickly check how a team typically performs in second-half scenarios before making a decision.
Timing is everything. After major plays, give the market 30–60 seconds to stabilize, and use that window to fade public overreactions. Budget management is equally important - stick to 3–5% of your total bankroll per session, with individual bets capped at 1–2%.
Blending automation with human expertise is key. Tools like WagerProof's Edge Finder and AI Game Simulator streamline analysis across sportsbooks, while insights from the Discord community and Real Human Editors add critical context that raw data alone can't provide. This approach isn't about blindly following picks - it's about learning to spot value independently. Tracking your Closing Line Value (CLV) after each bet is a reliable way to measure the effectiveness of your strategy. By combining these insights, you can create a flexible, data-driven betting strategy that adapts in real time.
FAQs
What live stats matter most for each sport?
When it comes to live stats, the key metrics can differ depending on the sport, but they all share a common goal: capturing the game's real-time dynamics. These stats usually highlight momentum shifts, scoring trends, and situational details that give a clearer picture of what's happening on the field, court, or rink.
In football (soccer), stats like expected goals (xG) and momentum flow are crucial. They provide insights into which team is dominating and the quality of chances being created. For basketball, keeping an eye on scoring runs and individual player performance can make all the difference, especially when momentum swings quickly.
Meanwhile, baseball and hockey rely on more specialized metrics. In baseball, tracking pitch speeds and pitch types can reveal a pitcher's form or fatigue. In hockey, analyzing shot quality - such as the angle and distance of shots - helps bettors gauge the likelihood of goals.
These real-time stats are invaluable for anyone looking to stay ahead of the game, whether you're betting, coaching, or just trying to understand the flow of play better.
How do I spot sharp money during a game?
To spot sharp money during a game, pay attention to reverse line movement (RLM) - this happens when the betting line moves in the opposite direction of public sentiment. For example, if a team receiving over 60% of the bets sees the line shift against them, it’s a strong indicator. Sharp bettors often place larger wagers, so discrepancies between the number of public bets (tickets) and the actual money wagered can also point to sharp action. Leveraging real-time data tools can make identifying these patterns much easier.
How can I avoid getting burned by streaming delays?
To reduce the effect of streaming delays during live betting, it's crucial to recognize that latency can cause your stream to fall behind real-time action. Rely on real-time data platforms to keep up with game developments and market changes. Focus on sports you're familiar with, as this helps you better predict plays and outcomes. Avoid making impulsive bets based solely on what you see on the screen - those delays could mean you're reacting to outdated information.
Related Blog Posts
Ready to bet smarter?
WagerProof uses real data and advanced analytics to help you make informed betting decisions. Get access to professional-grade predictions for NFL, College Football, and more.
Get Started Free