Using Closing Line Value for Historical Edge Testing
Want to know if your sports betting strategy is based on skill or luck? Closing Line Value (CLV) is the key metric to measure your edge. CLV compares the odds you bet at with the final odds offered before a game starts. If you consistently beat the closing line, it’s a strong indicator of long-term profitability. Here’s why it matters:
- CLV reflects your process, not just results. Positive CLV shows you’re identifying value before the market adjusts.
- It predicts future success better than win rates. A bettor with positive CLV is more likely to profit over time, even if short-term results fluctuate.
- Sportsbooks track CLV too. Consistently beating the closing line often leads to account restrictions, as it signals a genuine edge.
To calculate CLV, compare the odds you took to the “true” closing odds (adjusted for bookmaker margins). Over a large sample size, CLV aligns closely with ROI, revealing the strength of your strategy. Tools like WagerProof simplify tracking and analysis, helping you refine your approach and maximize your edge.
If you’re serious about betting, stop focusing solely on wins and losses. Start tracking CLV - it’s the most reliable way to test and improve your strategy.
What Is Closing Line Value (CLV) in Sports Betting?
Why Use CLV for Historical Edge Testing
CLV vs ROI: Understanding Betting Performance Metrics
Short-term outcomes can often mislead, making it hard to separate skill from luck. That's where Closing Line Value (CLV) steps in - it helps you measure the quality of your process rather than just relying on results.
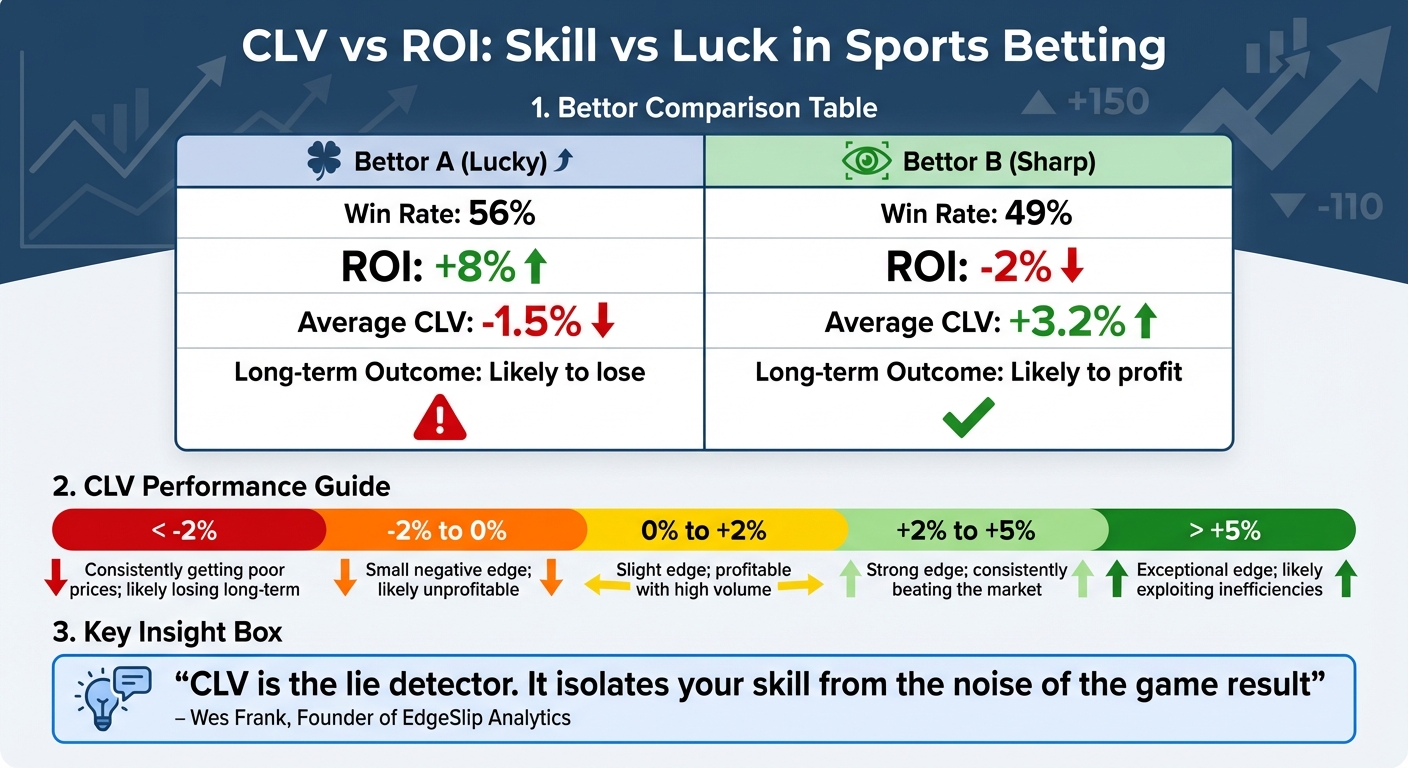
As Wes Frank, Founder of EdgeSlip Analytics, explains:
"CLV is the lie detector. It isolates your skill from the noise of the game result".
This distinction is crucial when analyzing long-term betting records. While ROI shows what happened, CLV reveals what should have happened. For example, a bettor with a 56% win rate and +8% ROI might seem successful, but a -1.5% CLV suggests they’ve been overpaying. That negative CLV indicates their profits are likely due to luck, not a genuine edge.
CLV as a Tool for Measuring Market Edge
By kickoff, thousands of bettors refine the closing line into the market's most precise price. Beating that number consistently shows you can spot value before the market adjusts.
This is why CLV is often viewed as a better predictor of future success than win-loss records. Short-term variance can distort win rates, even for skilled bettors. For instance, a bettor with a real 3% edge still has a 25% chance of being in the red after just 100 bets. But a strategy that consistently achieves positive CLV will, over time, translate into profits as the sample size grows.
Here’s a comparison of two bettors based on actual data:
| Metric | Bettor A (Lucky) | Bettor B (Sharp) |
|---|---|---|
| Win Rate | 56% | 49% |
| ROI | +8% | -2% |
| Average CLV | -1.5% | +3.2% |
| Long-term Outcome | Likely to lose | Likely to profit |
The Need for Large Sample Sizes
While 100 bets can give a rough idea of your CLV, a much larger sample is needed to confidently evaluate a strategy. Typically, ROI starts to align with CLV as the sample size grows to 2,000 or even 5,000 bets. This alignment happens because short-term variance can skew results, even for a solid process.
Take this example from Bet Hero in 2024: A value betting strategy started with a 47% win rate and -4.2% ROI over its first 100 bets, but it maintained a positive CLV of +2.8%. By the 2,000-bet mark, the win rate stabilized at 53%, ROI improved to +5.8%, and the CLV remained steady at +2.7%. This shows that the initial losses were simply due to variance.
When analyzing past strategies, aim for at least 2,000 to 3,000 bets to draw reliable conclusions. Smaller samples can lead to mistaking luck for skill - or abandoning a profitable strategy during a temporary slump. With larger samples, CLV and ROI together provide a clearer picture of your strategy's effectiveness.
Correlating CLV with ROI
Tracking both CLV and ROI helps confirm whether your strategy’s underlying value will eventually lead to positive results. If your CLV is positive but your ROI is negative, it’s a sign to stay the course - your edge is real, and profits should follow. On the flip side, if your ROI is positive but your CLV is near zero or negative, you might be riding a lucky streak that isn’t sustainable.
Breaking down these metrics by category, such as league, bet type, or timing, can uncover areas for improvement. For instance, you may find that one sport consistently beats the closing line while another doesn’t, insights that ROI alone wouldn’t reveal.
Here’s a quick guide to interpreting your CLV performance:
| Average CLV | Assessment |
|---|---|
| < -2% | Consistently getting poor prices; likely losing long-term |
| -2% to 0% | Small negative edge; likely unprofitable |
| 0% to +2% | Slight edge; profitable with high volume |
| +2% to +5% | Strong edge; consistently beating the market |
| > +5% | Exceptional edge; likely exploiting inefficiencies |
A steady CLV between +2% and +5% is often considered professional-grade. Anything above +5% may indicate a significant inefficiency in the market, though such opportunities might not last long as the market adjusts.
Step-by-Step Guide to Calculating CLV
Understanding how to calculate CLV is key to evaluating betting performance. This guide walks through the process, emphasizing the importance of accurate records and proper adjustments. The main objective? Compare the odds you locked in when placing your bet against the market's "true" odds at game time - going beyond the basic closing line.
Recording Bet Odds and Closing Odds
Start by logging all the details of your bets as soon as you place them. This includes the odds, point spread or total, timestamp, league, market type, and stake. When the event begins, record the closing odds from trusted sportsbooks. If you're tracking spreads or totals, consistency is essential. For example, if you bet a team at +3.5 but the closing line shifts to +4, use alternate lines or push tables to determine the odds at your original number. While spreadsheets can handle this, automated tools are a better option - they sync your bets and pull closing odds automatically, minimizing errors.
After recording, the next step is adjusting for bookmaker margins to find the true market odds.
Adjusting for Bookmaker Margins
Bookmaker odds include a built-in margin (the "vig"), which inflates implied probabilities above 100%. To uncover the fair market value, you need to remove this margin. Here’s how:
- Convert each side of the market into implied probabilities.
- Sum these probabilities.
- Normalize each probability by dividing it by the total.
For example, if both sides of a spread are listed at -110, the implied probabilities are about 52.4% each, adding up to 104.8%. Dividing each side by 1.048 gives no-vig probabilities of 50% per side.
This adjustment is crucial. Without it, you might misinterpret the odds. A move from -110 to -112 might seem favorable, but if the fair price (after removing the vig) is actually -101, you're still at a disadvantage. Adjusting for the vig aligns your calculations with the market's true value. As Bet-Analytix explains:
"The closing line is the closest estimate to statistical 'truth'. If you systematically bet at odds higher than the closing line, you are mathematically beating the market."
Computing Implied Yield
Once you've adjusted for the vig, you can calculate implied yield to measure your edge. Use this formula:
(Odds Taken / True Closing Odds) - 1
Make sure to convert all odds to decimal format for consistency. For instance, if you bet on a team at +110 (2.10 in decimal) and the market closes at -110 (1.91 in decimal), calculate CLV as:
(2.10 / 1.91) - 1 = +9.9%.
This result shows you secured nearly 10% more value than the market's final assessment.
To get meaningful insights, track your CLV over a large sample size - ideally 500 to 1,000 bets. Over time, your actual return on investment will likely align with your average CLV. Break down your CLV by league, bet type, and timing to uncover patterns and refine your strategy further.
Applying CLV to Test and Refine Betting Strategies
Once you've calculated your CLV (Closing Line Value), it becomes a powerful tool to pinpoint weaknesses and build on strengths. By breaking down performance by sport, bet type, and timing, you can uncover trends that go beyond short-term ROI.
Tracking Line Movements Across Sports
Sports betting markets vary widely in efficiency, and your CLV will mirror these differences. For example, high-liquidity markets like NFL spreads are incredibly efficient. Sharp bettors and large betting volumes ensure the closing line adjusts quickly. In these markets, a consistent CLV of +2% to +3% is considered excellent. On the other hand, niche markets like WNBA props or small-conference college basketball often have softer lines. Here, bettors aim for a CLV of +5% or more.
Analyzing monthly CLV by sport and bet type can reveal valuable insights. For instance, if your NFL sides show 0% CLV but your totals consistently hit +4%, it might be time to shift focus toward totals. Similarly, if you're excelling in NBA player props but struggling with MLB moneylines, reducing exposure in less efficient markets could improve results. As EdgeSlip aptly states:
"Stop celebrating wins that had negative CLV - those are bad habits rewarded by luck. Start celebrating losses that had positive CLV - those are good decisions punished by variance".
This type of analysis naturally leads to setting benchmarks for different bet types.
Comparing CLV Across Bet Types
Each type of bet operates under unique conditions, requiring specific CLV benchmarks. The table below outlines target CLV benchmarks for various markets:
| Bet Type / Market | Liquidity Level | Target CLV for Success | Market Efficiency |
|---|---|---|---|
| NFL/NBA Spreads | High | +2% to +3% | Very High (Efficient Market) |
| NFL/NBA Totals | High | +3% to +4% | High |
| MLB Moneylines | Moderate | +2% | Moderate |
| Player Props | Low | +5% or higher | Moderate (Less Efficient) |
| Niche/Small Leagues | Low | +5% to +7% | Low (Closing line may not be sharp) |
Using this framework, assess your betting strategy every 250 bets. If you notice declining CLV in a particular market over three consecutive periods, it may indicate a "regime shift", signaling the need to recalibrate your approach.
When combined with ROI data, these insights provide a comprehensive picture of your betting performance.
Integrating ROI and CLV Metrics
CLV and ROI work hand in hand to evaluate the strength of your betting strategy. While CLV measures the quality of your decision-making process and predicts future success, ROI reflects actual results, which are often influenced by short-term variance. Comparing these metrics can help you determine whether you're "running hot" (high ROI, low CLV) or "running cold" (low ROI, high CLV).
If your long-term CLV hovers near zero but your ROI is positive, you might be riding a lucky streak - consider scaling back your stakes. On the flip side, if you consistently achieve positive CLV but show negative ROI, stick with your strategy. Variance is likely the culprit, and your process is sound. Studies show that bettors who consistently achieve positive CLV often enjoy an ROI 2 to 3 times higher than those who only track win rates. For instance, maintaining an average 2% CLV across all bets typically translates to an ROI of about 4% over time.
To manage your bankroll effectively, adjust stake sizes based on consistent positive CLV in specific segments rather than relying solely on overall ROI. This approach keeps your focus on long-term success while helping you navigate the ups and downs of short-term results.
How WagerProof Simplifies CLV Analysis
Manually tracking closing line value (CLV) across hundreds of bets can feel like a never-ending chore. It’s not just time-consuming - it’s easy to make mistakes along the way. That’s where WagerProof steps in, automating the entire process. With this tool, you get instant access to professional-grade data and analytics that seasoned bettors trust, all without the headache of manual tracking. Plus, it seamlessly integrates with the CLV evaluation methods already discussed.
Using WagerProof's Historical Analytics
WagerProof's Historical Analytics feature takes the hassle out of data entry. It automatically tracks key metrics like CLV, ROI, log loss, and calibration for every bet you make. Forget spending hours building and updating spreadsheets. Instead, you can focus on analyzing your performance across different segments - whether it’s by league, market type, or time-to-start buckets. These detailed insights help you pinpoint exactly where your betting strategy is excelling or falling behind, allowing you to tweak underperforming areas with precision rather than guesswork.
While Historical Analytics simplifies your data collection, the Edge Finder tool goes a step further by highlighting actionable opportunities in the market.
Automated Edge Detection with Edge Finder
The Edge Finder tool is all about spotting value bets and market outliers in real time. It benchmarks bookmaker lines against market predictions and historical trends to identify mispriced odds. If market spreads are off or public betting patterns create exploitable gaps, Edge Finder flags these opportunities for you.
On top of that, you gain access to the AI Game Simulator, which runs thousands of simulations per game. It factors in real-time variables like injuries and weather conditions to validate potential betting edges before you commit. This combination of tools ensures you’re not just betting smarter but also more strategically.
Premium Features for Advanced Users
For those looking to take their betting to the next level, WagerProof offers a premium tier packed with advanced features. One standout is WagerBot Chat, an AI-powered assistant that provides tailored advice. Unlike generic responses, WagerBot pulls from live odds, line movements, and historical trends to answer your specific questions about CLV, market efficiency, or strategy tweaks.
Premium users also gain access to a private Discord community, where expert picks from Real Human Editors and real-time data insights can further refine your approach. Together, these premium features create a well-rounded ecosystem for testing, tracking, and sharpening your betting edge over time. Whether you’re fine-tuning your strategy or exploring new angles, WagerProof has the tools to make it happen.
Conclusion: Using CLV for Long-Term Betting Success
CLV stands out as one of the most dependable indicators of long-term profitability in sports betting. While short-term ROI can swing wildly, CLV offers a clearer picture of your actual betting skill.
Professional bettors often aim for an average CLV of +2% to +3% in major markets like NFL spreads. Maintaining a consistent edge of 2%–5% can lead to an annual ROI increase of 15%–25%.
The key is shifting your focus away from short-term wins and losses and toward a disciplined, process-driven approach. As EdgeSlip explains:
"The closing line is the receipt that proves you got a discount. Stop celebrating wins that had negative CLV - those are bad habits rewarded by luck."
This perspective helps you appreciate bets with positive CLV, even if they lose initially, while critically examining wins that stemmed from poor entry prices. To confirm a sustainable edge, you’ll need a large sample size - anywhere from 500 to 1,000 bets.
Automated tools like WagerProof simplify this process. WagerProof automatically tracks CLV along with ROI, log loss, and calibration metrics, saving you the hassle of manual spreadsheets. Its Historical Analytics and Edge Finder tools highlight which sports, markets, or strategies deliver the most value. Meanwhile, WagerBot Chat offers personalized advice using live data. By automating these tasks, you can focus on fine-tuning the parts of your strategy that perform best.
Consistently beating the closing line is what separates skilled bettors from those relying on luck. This steady CLV advantage explains why sportsbooks often limit accounts of successful bettors. Leveraging tools to systematically track CLV ensures you can build and sustain an edge over thousands of bets.
FAQs
What CLV is “good enough” to prove I have an edge?
A solid CLV often outperforms the closing odds by a slight margin, typically around +1% to +2%. This steady advantage reflects a real betting edge and shows that your strategy is delivering favorable outcomes over time.
How many bets are needed for CLV to be meaningful?
Tracking between 250 and 1,000 bets is typically recommended to make CLV (Closing Line Value) analysis meaningful. This sample size allows for a more accurate assessment of both long-term profitability and betting performance.
How do I calculate CLV correctly after removing the vig?
To figure out CLV (Closing Line Value) after taking out the vig, compare the odds you bet on to the no-vig (fair) odds provided by a sharp bookmaker. Use this formula: (Closing Odds / Your Odds) - 1. If the result is negative, it means you outperformed the closing line and have a positive expected value. This method is a useful way to assess your betting performance and fine-tune your strategy over time.
Related Blog Posts
Ready to bet smarter?
WagerProof uses real data and advanced analytics to help you make informed betting decisions. Get access to professional-grade predictions for NFL, College Football, and more.
Get Started Free