Using Prediction Markets for Correlated Parlays
Prediction markets and correlated parlays can help you spot betting opportunities that sportsbooks might misprice. Prediction markets reflect real-time probabilities based on collective trader insights, while sportsbooks adjust odds to manage risk. By comparing market probabilities with sportsbook lines, you can identify gaps and build smarter bets.
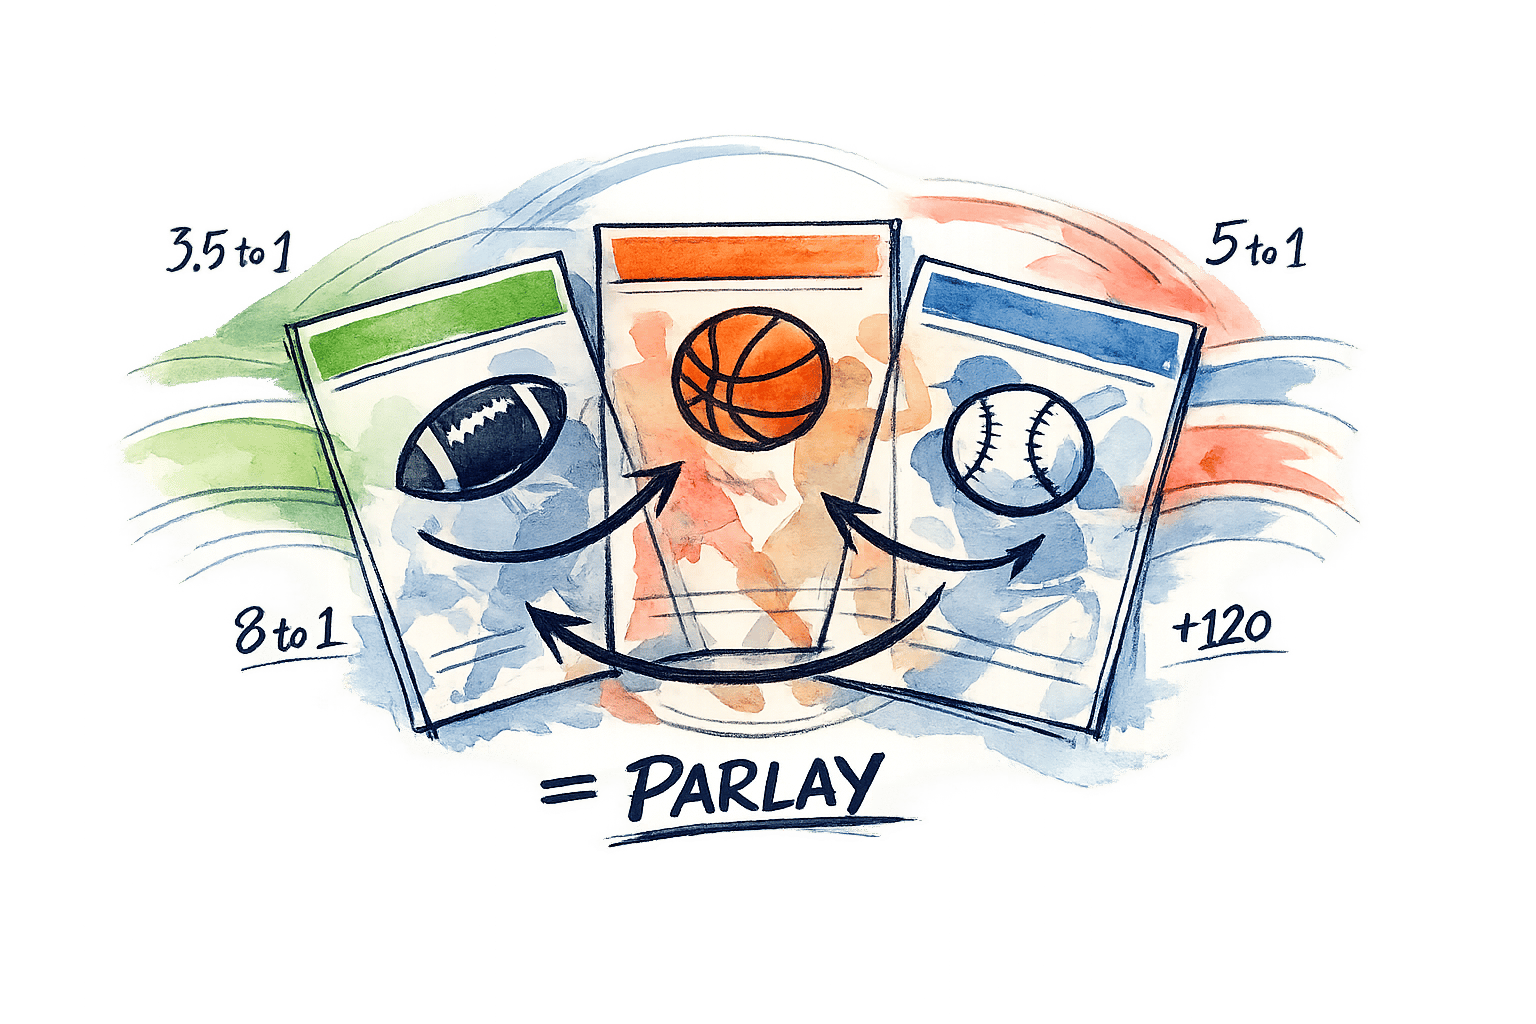
Correlated parlays link outcomes that influence each other, like a quarterback’s passing yards and their receiver’s yards. Sportsbooks often misprice these correlations, especially across games, creating potential value for bettors. Tools like WagerProof can analyze data, highlight mispriced odds, and simulate probabilities to help you optimize your bets. Stick to 2–3 leg parlays to balance risk and reward, and always verify correlations with historical data and simulations.
Key takeaways:
- Use prediction markets to find mispriced sportsbook odds.
- Focus on correlated outcomes with a strong statistical link.
- Leverage tools like WagerProof to analyze probabilities and gaps.
- Avoid overloading parlays and manage risks like blowouts or conflicting bets.
Smart betting comes down to comparing odds, analyzing correlations, and using data-driven strategies to find a betting edge.
What Everyone gets WRONG About Correlated Parlays
Why Prediction Markets Help Find Correlated Parlays
Prediction markets and sportsbooks approach probability calculation in fundamentally different ways, and understanding this distinction is where the opportunity lies. Sportsbooks rely on proprietary models and expert analysis to set their initial odds. Once the bets start rolling in, they tweak those odds based on betting volume, aiming to balance their financial exposure and secure a profit. Their primary focus isn't pinpointing the exact probabilities - it’s about managing risk and ensuring profitability.
Prediction markets, on the other hand, operate differently. They reflect the collective opinions of participants in real time. The market price here is essentially a snapshot of collective intelligence, offering a more direct measure of actual probability.
This difference is crucial when it comes to correlated parlays. Sportsbooks adjust odds based on public sentiment rather than pure probability. They also account for the inherent connections between events in parlays. For instance, sportsbooks often apply a 15–25% discount on payouts for correlated bets because they know the outcomes aren’t independent. Using advanced models like Gaussian copulas, they price these bets, but the lack of transparency in their methods creates opportunities for savvy bettors.
"Bettors cannot easily calculate true probabilities for correlated events... This information asymmetry allows books to build in larger edges without customer resistance".
This gap between public perception and true probabilities is where prediction markets can shine, offering a way to identify mispricings.
Comparing Market Probabilities to Sportsbook Lines
To uncover value, compare the probabilities implied by prediction markets with sportsbook odds. A study of 1,000 NBA games during the 2024–25 season found that public prediction markets like Polymarket achieved a predictive accuracy of 67%, while major sportsbooks aggregated via OddsPortal reached 66%. While a 1% difference might seem trivial, it can make a big impact when building multi-leg parlays.
By converting prediction market prices into implied probabilities and comparing them with sportsbook odds, you can spot where the value lies. For example, a three-leg parlay with -110 odds on each leg has a 14.4% win probability if the legs are independent. But if they’re positively correlated, the true probability can jump to 21.2% or more. Sportsbooks often exploit this correlation to shorten payouts.
Using Aggregated Market Data
One of the strengths of prediction markets is their ability to preserve conditional probabilities - how one event affects another. Logarithmic market scoring rules, for example, are designed to maintain these relationships. As Robin Hanson from George Mason University explains:
"Scoring rules elicit accurate individual estimates and collective consensus".
This makes prediction markets particularly useful for identifying correlations that sportsbooks might misprice. Negative correlations, in particular, can often be overlooked. For instance, if a blowout favorite wins while their star player falls "under" on a prop bet, sportsbooks may misprice this scenario because it goes against the expectations of casual bettors. Aggregated market data can cut through this bias, revealing the actual probabilities and helping you optimize your correlated parlays.
How to Use Prediction Markets for Correlated Parlays
4-Step Process for Building Correlated Parlays Using Prediction Markets
Now that the groundwork is laid, let’s dive into how you can use prediction market data to build correlated parlays. These four steps take you from analyzing raw data to creating parlays with a measurable edge.
Step 1: Access Live Prediction Market Data with WagerProof

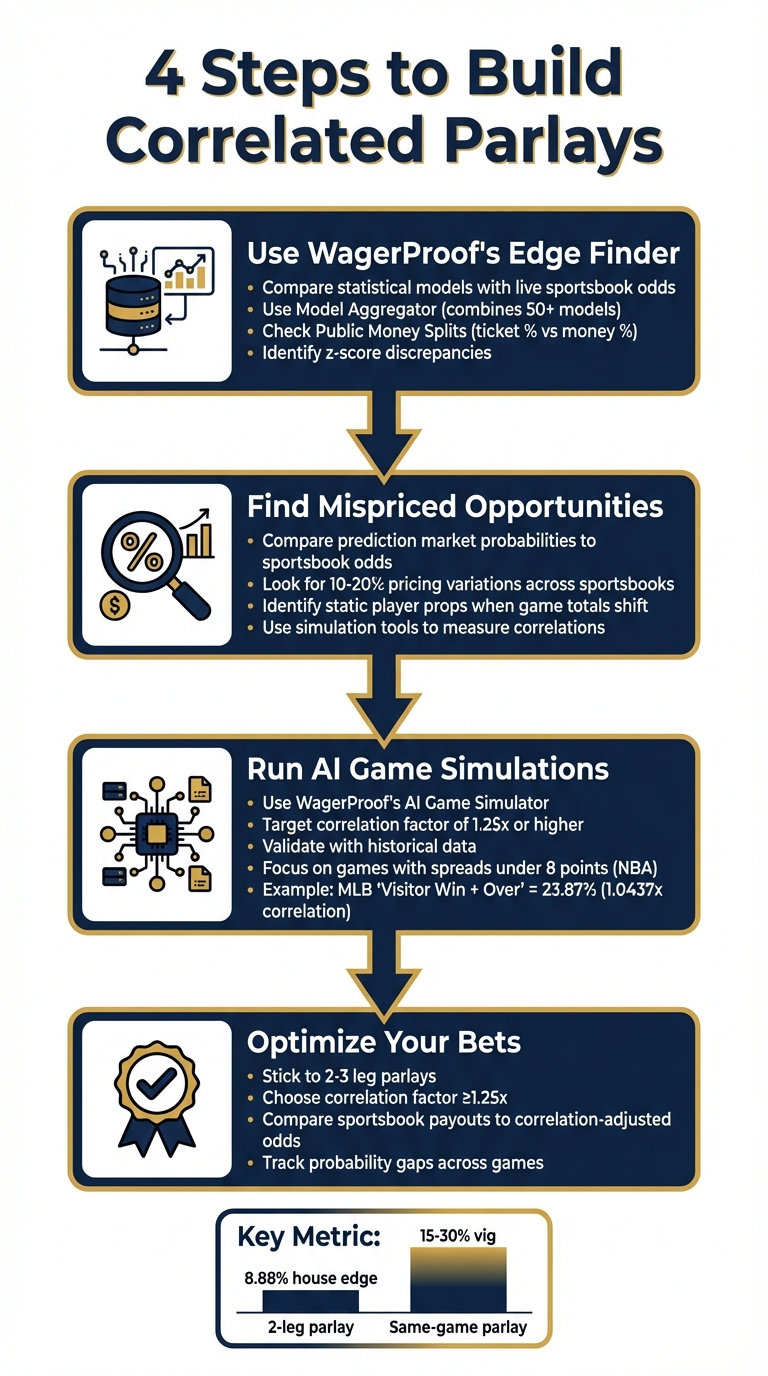
Start by using WagerProof's Edge Finder to compare statistical models with live sportsbook odds. This tool highlights discrepancies through z-scores, making it easier to spot potential value. The Model Aggregator combines data from 50 different models, offering a clear view of where sharp bettors are finding opportunities. Additionally, the Public Money Splits feature helps you differentiate between casual bettors (reflected in ticket percentages) and sharper action (indicated by money percentages). This can reveal when sportsbooks adjust lines based on betting patterns rather than true probabilities.
Step 2: Spot Gaps Between Prediction Markets and Sportsbooks
Look for situations where prediction market probabilities differ significantly from sportsbook odds. For example, if a prediction market gives a team a higher win probability than the sportsbook’s line suggests, this could indicate a mispriced opportunity. Pay attention to related player props that remain static even when game totals shift. It’s also worth noting that same-game parlays (SGPs) can vary in pricing by as much as 10–20% across different sportsbooks. Once you’ve identified a target, use simulation tools to measure how correlated the outcomes are.
Step 3: Analyze Correlations Between Outcomes
Leverage WagerProof's AI Game Simulator to run thousands of simulations and identify how often specific outcomes occur together. Start by crafting a logical game narrative. For instance, if an underdog home team wins, the game might lean toward being low-scoring. Historical data can validate these narratives. For example, an analysis of 27,625 MLB games (2010–2021) revealed that "Visitor Win + Over" parlays occurred 23.87% of the time, slightly above the 22.87% expected if outcomes were independent - a correlation factor of 1.0437.
For NBA player props, focus on games with spreads under 8 points to avoid blowouts that could limit star players’ minutes. Also, consider negative correlations, such as a heavy favorite winning while a star player underperforms. These scenarios are often mispriced because they go against typical bettor expectations.
Step 4: Build Your Correlated Parlays
Stick to 2–3 leg parlays to reduce the vig and maintain your edge. Choose events that are statistically more likely to occur together - aim for a correlation factor of at least 1.25x. Compare the sportsbook payouts to your correlation-adjusted odds to ensure you’re getting a positive edge. Use WagerProof’s tools to track these probability gaps across games and identify the best combinations before placing your bets.
| WagerProof Tool | Primary Function | Key Output for Parlays |
|---|---|---|
| Edge Finder | Compares models to market odds | Highlights outliers and consensus gaps (z-scores) |
| AI Game Simulator | Runs thousands of simulations | Provides joint outcome probabilities |
| Model Aggregator | Combines data from 50 models | Offers standardized views on line accuracy |
| WagerBot Chat | Real-time data queries | Delivers instant insights on correlation scenarios |
| Public Money Splits | Tracks ticket vs. money percentages | Exposes sharp vs. public betting discrepancies |
How to Manage Risks and Avoid Mistakes
Even well-researched data can backfire if your parlays are built on conflicting outcomes. For example, pairing a high "Over" on a running back's carries with a high "Over" on passing yards in the same game creates a contradiction. These scenarios rarely align, and sportsbooks are quick to capitalize on such mismatches.
Another common pitfall is blowout risk. In leagues like the NBA and NFL, when a team dominates with a large lead, star players often sit out the final quarter. This can derail player prop "Overs", even if the team covers the spread, leaving you with a losing ticket despite the game's overall result.
Don't Overestimate Correlations
Once you've identified potential risks, it’s crucial to confirm whether your assumptions about correlations hold up under scrutiny. Just because two outcomes seem connected doesn’t mean they actually are. Sportsbooks have extensive data on popular combinations like "Favorite Win + QB Over + Game Over", and they aggressively price these bets with a house edge of 15–25%. These are precisely the bets where sportsbooks have the upper hand.
Instead, focus on empirical frequency - look at historical data to see how often certain outcomes truly occur together under similar conditions. Tools like WagerProof's AI Game Simulator can help you test these assumptions by running thousands of scenarios to reveal the actual joint probabilities. This approach ensures your bets are grounded in reality, not just intuition.
Balance Risk and Reward
To make smarter parlays, you need to weigh potential returns against the inevitable house edge. The ideal parlay size for correlated bets is 2–3 legs. Adding more legs increases both variance and the house's advantage. For context, a 2-leg parlay typically carries an 8.88% house edge, while a single bet has an edge of about 4.55%. Same-game parlays can be even less favorable, with sportsbooks tacking on a 15–30% vig compared to the standard 4.5% on -110 bets.
To maximize value, compare same-game parlay odds across multiple sportsbooks. Pricing for identical bets can differ by 10–20% between platforms. Additionally, consider cross-game correlated parlays, which often offer better odds. For instance, weather conditions impacting multiple outdoor NFL games on the same day are harder for sportsbooks to price accurately, giving you an edge.
Conclusion
Making profitable correlated parlays comes down to using data-driven strategies and focusing on joint probabilities rather than simply multiplying independent odds. By tapping into prediction market data to spot mispriced correlations, you can gain the same kind of edge that sharp bettors use to exploit gaps in sportsbook pricing.
A key takeaway is the importance of verification. Before placing a same-game parlay, always compare the sportsbook's odds to the result you'd get by multiplying the individual legs' odds. This simple step uncovers the "hidden correlation tax." On the other hand, cross-game correlated parlays - those influenced by factors like weather or scheduling - often present better opportunities because they're tougher for sportsbooks to price accurately.
Tools like WagerProof can make this process easier. For example:
- The Edge Finder highlights mispriced lines with z-scores above 2.0.
- The AI Game Simulator calculates joint probabilities across thousands of scenarios.
- WagerBot Chat helps analyze live correlation patterns.
- The Model Aggregator blends over 50 forecasts to reduce bias.
- Public Money Splits reveal sharp money versus public betting trends.
To maximize your chances, stick with 2–3 correlated legs. This keeps the house edge manageable. While standard bets carry about a 4–5% house edge, same-game parlays can skyrocket that to 15–30%. Adding more legs not only increases variance but also amplifies the sportsbook’s advantage, making consistent profitability nearly impossible without a strong edge.
Ultimately, winning parlays depend on having the right data at the right time. With WagerProof’s automated alerts, you'll know when odds deviate from true probabilities or when situational factors shift - giving you the insights needed to make smarter, more informed bets.
FAQs
How do I turn a prediction market price into an implied probability?
To figure out the implied probability from a prediction market price, take 100 and divide it by the price expressed as a percentage. For instance, if the market price is 64%, the implied probability would be 62.5%. This approach gives you insight into the likelihood suggested by the market odds.
How can I estimate the true correlation between two parlay legs?
To get a clear picture of the relationship between two parlay legs, you’ll need to dig into their statistical connection. One effective way to do this is by using tools like correlation coefficients (such as Pearson’s). These coefficients help measure how strongly two variables are related.
Once you’ve established this relationship, compare the sportsbook’s pricing with the actual probabilities you’ve calculated based on the correlation. This step ensures you’re not just relying on the sportsbook’s implied odds but are basing your decisions on deeper analysis.
To make things easier, tools like correlation matrices and same-game parlay (SGP) engines can uncover meaningful connections that go beyond the assumption of independence. By identifying these relationships, you can better judge the value of your parlay bets and make more informed decisions.
How can I tell if a same-game parlay payout includes a hidden correlation tax?
When evaluating same-game parlay payouts, it’s important to spot any hidden "correlation tax." This occurs when sportsbooks adjust payouts for legs that are positively correlated, meaning the outcomes are statistically linked. If the implied probability in the odds doesn’t match the actual correlation between events, you’re likely dealing with this hidden adjustment. Tools such as WagerProof can assist in breaking down these discrepancies, helping you identify potential value in your bets.
Related Blog Posts
Ready to bet smarter?
WagerProof uses real data and advanced analytics to help you make informed betting decisions. Get access to professional-grade predictions for NFL, College Football, and more.
Get Started Free