How Vegas Closing Lines Predict Outcomes
Vegas closing lines are the final odds set by sportsbooks right before a game starts. They’re widely regarded as the most accurate predictions because they account for all factors - sharp betting patterns, injuries, weather, and other last-minute updates. This makes them a key benchmark for evaluating betting strategies and predictive models.
Here are the main takeaways:
- What are closing lines? These are the final odds after sportsbooks adjust for market activity and new information.
- Why are they accurate? They reflect collective market knowledge, including sharp bettors' insights and breaking news.
- Key metrics: Metrics like Closing Line Value (CLV) and Reverse Line Movement (RLM) help identify if your bets have an edge.
- Improving predictions: Tracking historical closing lines and analyzing patterns can refine your betting models and strategies.
- Tools like WagerProof: Automation tools help track CLV, monitor sharp money movements, and identify market inefficiencies.
Consistently beating the closing line is a strong indicator of long-term betting success, as even a small edge can significantly boost your ROI.
Closing Line Value (CLV) EXPLAINED: How to Beat the Market in Sports Betting
How Closing Lines Improve Predictive Models
Key Metrics for Evaluating Vegas Closing Lines and Betting Performance
Closing lines are a critical tool for assessing how well your predictive model performs. If your model regularly captures positive Closing Line Value (CLV), it suggests you’re identifying value before the market adjusts. This not only highlights your model’s strengths but also exposes areas that might need improvement. By focusing on key metrics like CLV and Reverse Line Movement (RLM), you can quantify these insights and refine your approach.
Key Metrics from Closing Lines
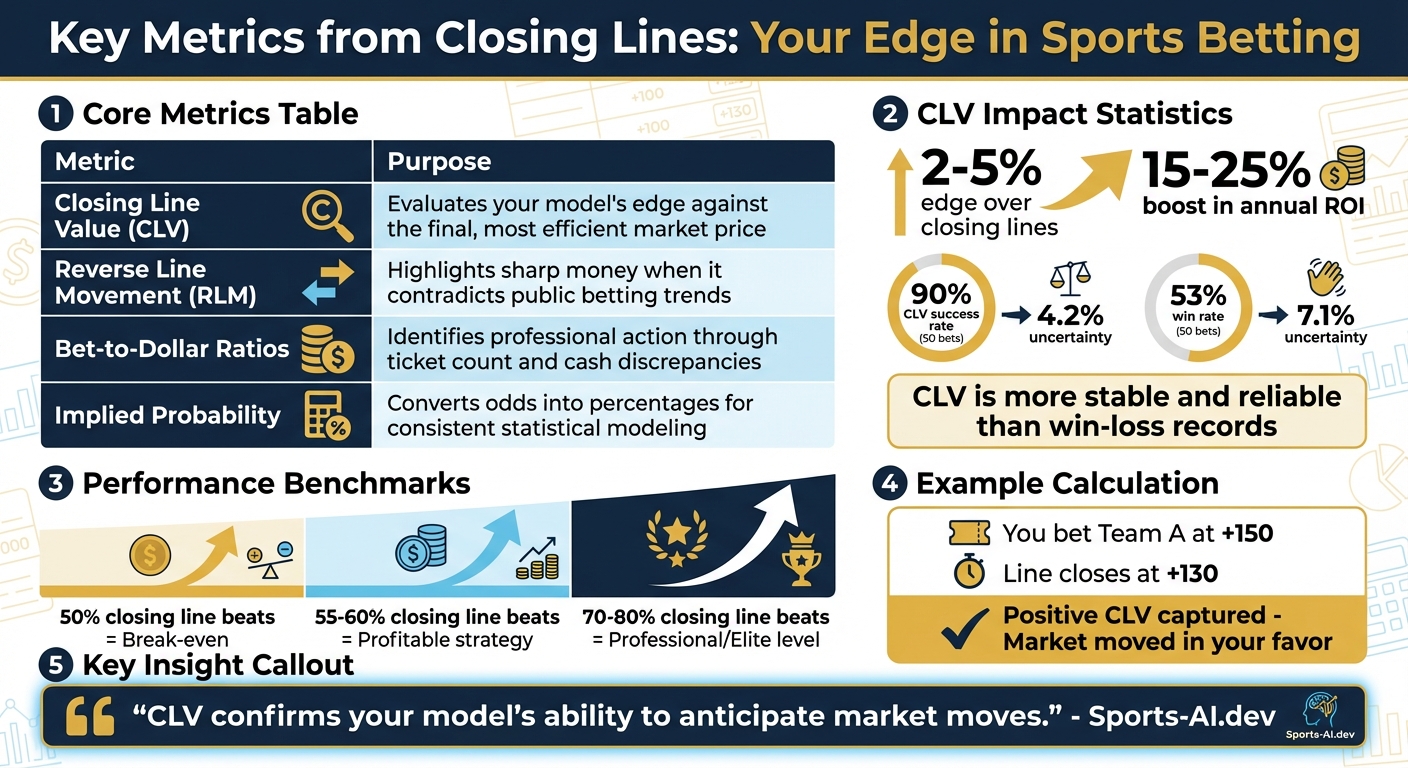
Closing Line Value (CLV) reflects the difference between the odds you secured and the final odds before the event begins. It’s a strong indicator of whether your model has a measurable edge. For instance, if you bet on a team at +150 and the line closes at +130, you’ve captured positive CLV. This means the market moved in your favor after your bet.
"CLV confirms your model's ability to anticipate market moves." - Sports-AI.dev
Reverse Line Movement (RLM) happens when the betting line shifts in the opposite direction of public betting trends. For example, if 70% of wagers are on Team A but the line moves to favor Team B, it often signals professional (or "sharp") money. This metric is particularly useful for identifying hidden value. Bet-to-dollar ratios further enhance this analysis. When a smaller percentage of tickets accounts for a larger share of the money wagered (e.g., 30% of bets but 60% of the cash), it indicates significant professional interest.
Another useful measure is the margin of victory versus spread. In college football, for example, the standard deviation of the final margin compared to the Vegas spread typically ranges from 14 to 15 points. Understanding this variance allows you to fine-tune your confidence intervals and adjust stake sizes based on predicted outcome distributions.
| Metric | Purpose in Predictive Modeling |
|---|---|
| Closing Line Value (CLV) | Evaluates your model’s edge against the final, most efficient market price |
| Reverse Line Movement (RLM) | Highlights sharp money when it contradicts public betting trends |
| Bet-to-Dollar Ratios | Identifies professional action through ticket count and cash discrepancies |
| Implied Probability | Converts odds into percentages for consistent statistical modeling |
Capturing a 2–5% edge over closing lines can significantly improve ROI, potentially boosting annual returns by 15–25%. For example, in a sample of 50 bets, achieving CLV on 90% of them results in an uncertainty of just 4.2%, compared to 7.1% uncertainty for a 53% win rate. This makes CLV a more stable and reliable indicator than win-loss records.
Using Historical Closing Line Data
Tracking historical closing lines is essential for auditing your model’s long-term performance. By analyzing these metrics over time, you can uncover shifts in patterns and identify blind spots in your approach. For instance, reviewing rolling windows of 100–500 bets can help you spot regime changes or account for overlooked factors like weather or lineup adjustments.
Segmenting CLV data by league, market type, or time-to-kickoff can reveal areas where your model consistently underperforms. This analysis can help you identify missing features - factors the market accounts for but your model doesn’t, such as late-breaking news or player injuries.
It’s also crucial to use data from sharp sportsbooks like Pinnacle or Circa as benchmarks. These books handle high-limit wagers and offer some of the most efficient pricing in the market. When incorporating data from different markets, such as Asian Handicap or 1X2, normalize everything to implied probabilities for consistency in training your model. For spread and total bets, tools like push tables and half-point calculators can translate point movements into win probability shifts.
"Betting markets are the sum of all prediction models." - Mo Nuwwarah, Writer, TheLines
Professional bettors aim to beat the closing line on 70–80% of their wagers. Hitting the closing line 50% of the time is considered break-even. If your model shows positive ROI but neutral or negative CLV, it might be riding a streak of good luck. In such cases, scaling back your stake sizes until you confirm a consistent edge is a wise move.
How to Use Closing Lines for Better Predictions
Incorporating closing lines into your predictive workflow can sharpen your betting strategy. By tracking line movement, comparing outcomes to final spreads, and analyzing historical data, you can refine your approach to forecasting market prices.
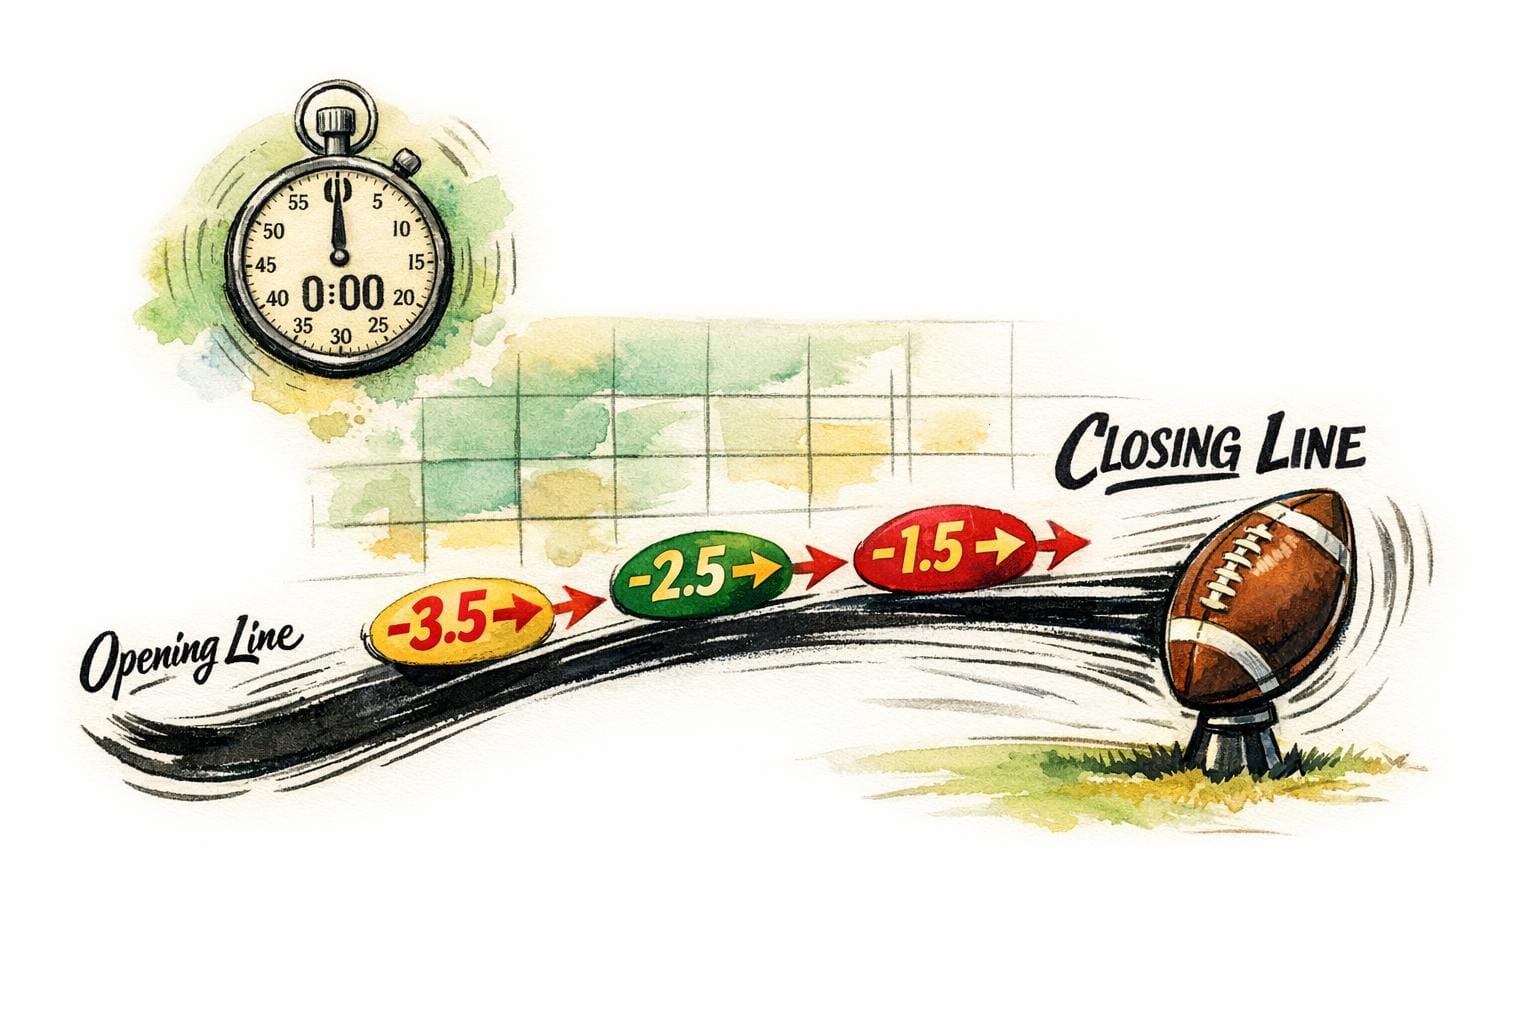
Step 1: Track Line Movement Patterns
Start by observing how lines shift from their opening to closing values. The opening line represents the bookmaker's initial estimate, while the closing line reflects the most up-to-date market information, including sharp money activity. Look for Reverse Line Movement (RLM) signals, which often indicate professional betting patterns.
Pay attention to steam moves - sudden, synchronized line changes across multiple sportsbooks. These shifts are typically driven by betting syndicates and can reveal market inefficiencies. Acting early on these signals can give you a strategic advantage.
In NFL betting, focus on key numbers like 3 and 7. Movements that cross these critical thresholds carry more weight than shifts between other numbers, such as 10 and 11. To measure your performance, track your Closing Line Value (CLV) using the formula (Closing Odds / Placed Odds) - 1. This helps you assess whether your bets consistently beat the market’s final price.
Step 2: Compare Outcomes to Closing Lines
Use closing lines from high-limit sportsbooks as a benchmark for accuracy. By removing the bookmaker's commission, you can calculate no-vig lines, which reveal the "true" probabilities. Standardize these odds into implied probabilities for easier comparisons.
"The closing price of books that take high-limit wagers represent the most accurate look at these probabilities." - Mo Nuwwarah
Keep a detailed log of every bet, including timestamps, league, market type, entry odds, and your model’s predicted probabilities. Organize this data by league and market type to identify patterns in your performance. Regularly evaluate your results using rolling windows of 250 to 1,000 bets. This approach helps you spot shifts in your model’s effectiveness or signs of degradation early. If your model shows a positive ROI but a neutral or negative CLV over a large sample, it may suggest that luck, rather than skill, is driving your success.
Once you’ve analyzed these comparisons, adjust your models to address any weaknesses.
Step 3: Predict Spreads with Statistical Models
Use insights from closing lines to forecast future spreads. Since closing lines incorporate all available information - such as injuries, weather conditions, and sharp betting activity - they serve as a reliable market consensus.
Train your models using no-vig closing lines and recalibrate them regularly with sample sizes of 100 to 500 bets. Maintaining a consistent edge of 2%–5% over closing lines can significantly enhance your ROI. Identify areas where your model underperforms, such as player pace or travel-related impacts, and adjust these features accordingly. Instead of focusing on short-term ROI, align your stake sizes with sustained positive CLV. A consistent edge over closing lines can boost your annual ROI by 15% to 25%.
Finding Betting Edges with Closing Lines
Once you've honed your predictive models, the next step is to use closing line data to identify real betting advantages. The closing line represents the market's final consensus - the sharpest probability estimate before kickoff. If you consistently secure odds better than this final price, you're uncovering true value. This approach helps refine your model by exposing market inefficiencies and tracking sharp betting activity.
Spotting Market Discrepancies
Market discrepancies occur when sportsbooks adjust their odds at different speeds. Sharp books like Pinnacle, Circa, and Bookmaker tend to lead the way when professional money influences the market. Retail sportsbooks, however, often lag behind, leaving temporary pricing gaps that savvy bettors can exploit.
To capitalize on these gaps, focus on line shopping. Keep accounts funded at multiple sportsbooks so you can seize "stale" numbers before they align with the market consensus. Comparing your bet price to the no-vig closing line across various books is essential for spotting value.
Another key indicator is the relationship between public betting percentages and line movement. If most bets favor one side but the line shifts in the opposite direction, it suggests large wagers from professionals are influencing the odds. This mismatch between public volume and line movement highlights where the sharp money is going. Beyond these gaps, Reverse Line Movement offers even more insight.
Using Reverse Line Movement
Reverse Line Movement (RLM) is a powerful tool for identifying sharp action. It occurs when a betting line moves against the majority of public bets. This pattern signals that professional bettors, who place larger and more influential wagers, are backing the other side.
"Consistently getting numbers better than the close is the mark of a winning bettor." - LoserWins
To track RLM, compare the percentage of total bets to the percentage of total money wagered. For example, if a team receives only 30% of bets but accounts for 60% of the money, it indicates that sharper, higher-stakes bettors are backing that side. Over a 17-year span, the team that the line initially moved toward in the Super Bowl covered the spread 12 times out of 17.
Also, watch for steam moves - sudden, synchronized line changes across multiple sportsbooks caused by betting syndicates. These moves happen quickly, and the value disappears just as fast. Instead of chasing steam moves, use them to anticipate sharp money and act early. Aiming to beat the closing line on 55% to 60% of your bets is a sign of a profitable strategy, while hitting 70% or more places you in elite territory.
Improving Your Betting Strategy with WagerProof
Manually tracking closing lines can be tedious and prone to mistakes. WagerProof eliminates that hassle by automatically pulling real-time data from sharp sportsbooks. It calculates your Closing Line Value (CLV) for each wager, helping you determine if your model identifies genuine edges or if you're simply riding on luck. This automation opens the door to sharper insights and a more refined betting strategy.
Access Pro-Level Data and Insights
WagerProof brings prediction markets, historical stats, and public betting percentages together in one easy-to-use platform. With consolidated odds data, you can instantly compare your entry price to the closing line. The platform even breaks down CLV by league or market, helping you pinpoint where your model might be slipping - whether due to injuries, lineup changes, or other factors. For instance, if your NBA bets consistently show positive CLV but your NFL wagers fall short, you’ll know exactly where to focus your adjustments.
Data from WagerProof also highlights trends in timing. Bets placed more than 24 hours before kickoff tend to gain an average of +1.2% CLV, while those made in the final hour often lose about –0.5%. By analyzing these patterns, you can tweak your betting schedule to maximize value. And if you maintain an average 2% CLV across all bets, you could see around a 4% ROI in traditional betting scenarios.
This combination of consolidated data and automation takes much of the guesswork out of your decisions.
Automate Edge Detection with WagerBot Chat
WagerBot Chat is your personal assistant for spotting value bets. Connected to live professional data feeds, it flags opportunities like steam moves - those sudden line changes that indicate sharp money - so you can act before the value disappears. Unlike generic chatbots, WagerBot pulls directly from real-time sources that influence closing lines, ensuring its alerts are based on actual market activity.
You can also set up alerts for stale lines. When WagerBot identifies discrepancies, you’ll have the chance to lock in odds before the market corrects itself. This feature not only saves you hours of manual monitoring but also reduces the risk of missing fleeting opportunities.
Join a Transparent Betting Community
WagerProof’s private Discord community connects you with other bettors who are serious about improving their strategies. Members share insights on CLV tracking, model audits, and real-time line movement analysis. Expert picks with detailed breakdowns are provided by Real Human Editors, adding another layer of value. With access available on web, iOS, and Android, you can stay on top of closing lines and tap into community expertise no matter where you are.
Conclusion
Vegas closing lines are widely regarded as the most accurate reflection of the market price. By the time of kickoff, these lines have accounted for every critical factor - injuries, weather conditions, sharp money movements, and advanced modeling inputs. This is why Closing Line Value (CLV) is considered the ultimate measure of betting skill. Even if short-term losses occur, consistently outperforming the closing line indicates long-term profitability. To put it in perspective, gaining just half a point on an NFL spread can boost your win rate from 50% to 52.9%, a shift that turns a losing strategy into a winning one.
Small advantages often separate a winning season from a losing one. Historical data highlights that a seemingly minor 0.5-point edge over the closing line can mean the difference between profit and loss. Consistently beating the closing line is a clear sign of skill, not luck.
WagerProof simplifies the challenge of tracking these margins. By pulling real-time data from sharp sportsbooks, it calculates your CLV for every wager. The platform aggregates prediction markets, historical stats, and public betting percentages into a user-friendly interface, allowing you to compare your entry price to the closing line instantly. Additionally, WagerBot Chat keeps you informed about steam moves and stale lines, helping you seize fleeting opportunities.
Incorporating closing line analysis into your betting strategy is crucial for sustained success. It serves as the benchmark for distinguishing skillful forecasting from chance, providing a reliable indicator of how well your models predict market trends. With WagerProof’s automated tools, real-time insights, and collaborative community, you can fine-tune your models and uncover genuine betting edges - no guesswork required.
FAQs
How can I consistently beat the Vegas closing line in sports betting?
To outperform the Vegas closing line consistently, the key is to place bets at odds that are better than the final market line. This means spotting value opportunities early, staying ahead of market shifts, and comparing odds across multiple sportsbooks to find the most favorable ones.
Keeping track of your Closing Line Value (CLV) is crucial for evaluating your long-term success. A positive CLV shows you're finding advantages over the market, which is essential for staying profitable over time. By combining sharp analysis with access to live betting data, you can fine-tune your approach and increase your chances of beating the closing line.
How do sharp bettors influence Vegas closing lines?
Sharp bettors are essential in fine-tuning Vegas closing lines. By spotting inefficiencies in the market and placing bets based on their thorough analysis and expertise, they push sportsbooks to adjust lines closer to the actual probabilities of an outcome. Their wagers often reflect the most informed and precise predictions available.
As a result, the closing line becomes a more balanced and efficient reflection of the game, integrating the sharpest insights from the betting market. Recognizing how sharp bettors influence these lines can help you improve your own predictions and uncover potential value in the odds.
Why does Closing Line Value (CLV) matter in sports betting?
Closing Line Value (CLV) is a key metric in sports betting that indicates whether you’ve consistently locked in better odds than the final market line. Why does this matter? Because beating the closing line over time is a solid sign of long-term profitability. It shows you’re skilled at spotting value before the market fully adjusts.
Understanding CLV can help you sharpen your betting strategies and make smarter decisions. Tools like WagerProof are especially useful for this. They let you track market movements in real-time, identify outliers, and spot potential opportunities - keeping you ahead of the closing line.
Related Blog Posts
Ready to bet smarter?
WagerProof uses real data and advanced analytics to help you make informed betting decisions. Get access to professional-grade predictions for NFL, College Football, and more.
Get Started Free